

Question: The table below gives Minitab output for the multiple regression of log Sales vs. Housing Starts and Mortgage Rate Regression Analysis: Log Sales versus Housing
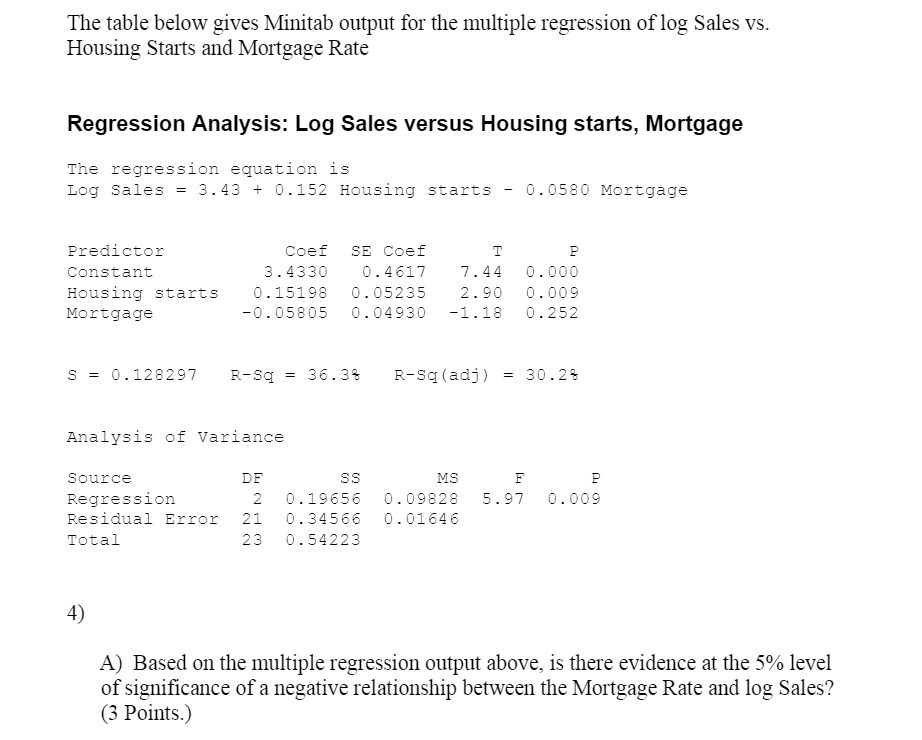
The table below gives Minitab output for the multiple regression of log Sales vs. Housing Starts and Mortgage Rate Regression Analysis: Log Sales versus Housing starts, Mortgage The regression equation is Log Sales = 3.43 + 0.152 Housing starts 0.0580 Mortgage Predictor Coef SE Coef T P Constant 3.4330 0.4617 7.44 0.000 Housing starts 0.15198 0.05235 2.90 0.009 Mortgage -0.05805 0.04930 -1.18 0.252 S = 0.128297 R-Sq = 36.3% R-Sq{adj) = 30.2% Analysis of Variance Source 3F 53 MS F P Regression 2 0.19656 0.09828 5.97 0-009 Residual Error 21 0.34566 0.01646 Total 23 0.5422 4) A) Based on the multiple regression output above, is there evidence at the 5% level of signicance of a negative relationship between the Mortgage Rate and log Sales? (3 Points.)
Step by Step Solution
There are 3 Steps involved in it

Get step-by-step solutions from verified subject matter experts