

Question: The table below gives the age and bone density for five randomly selected women. Using this data, consider the equation of the regression line, y
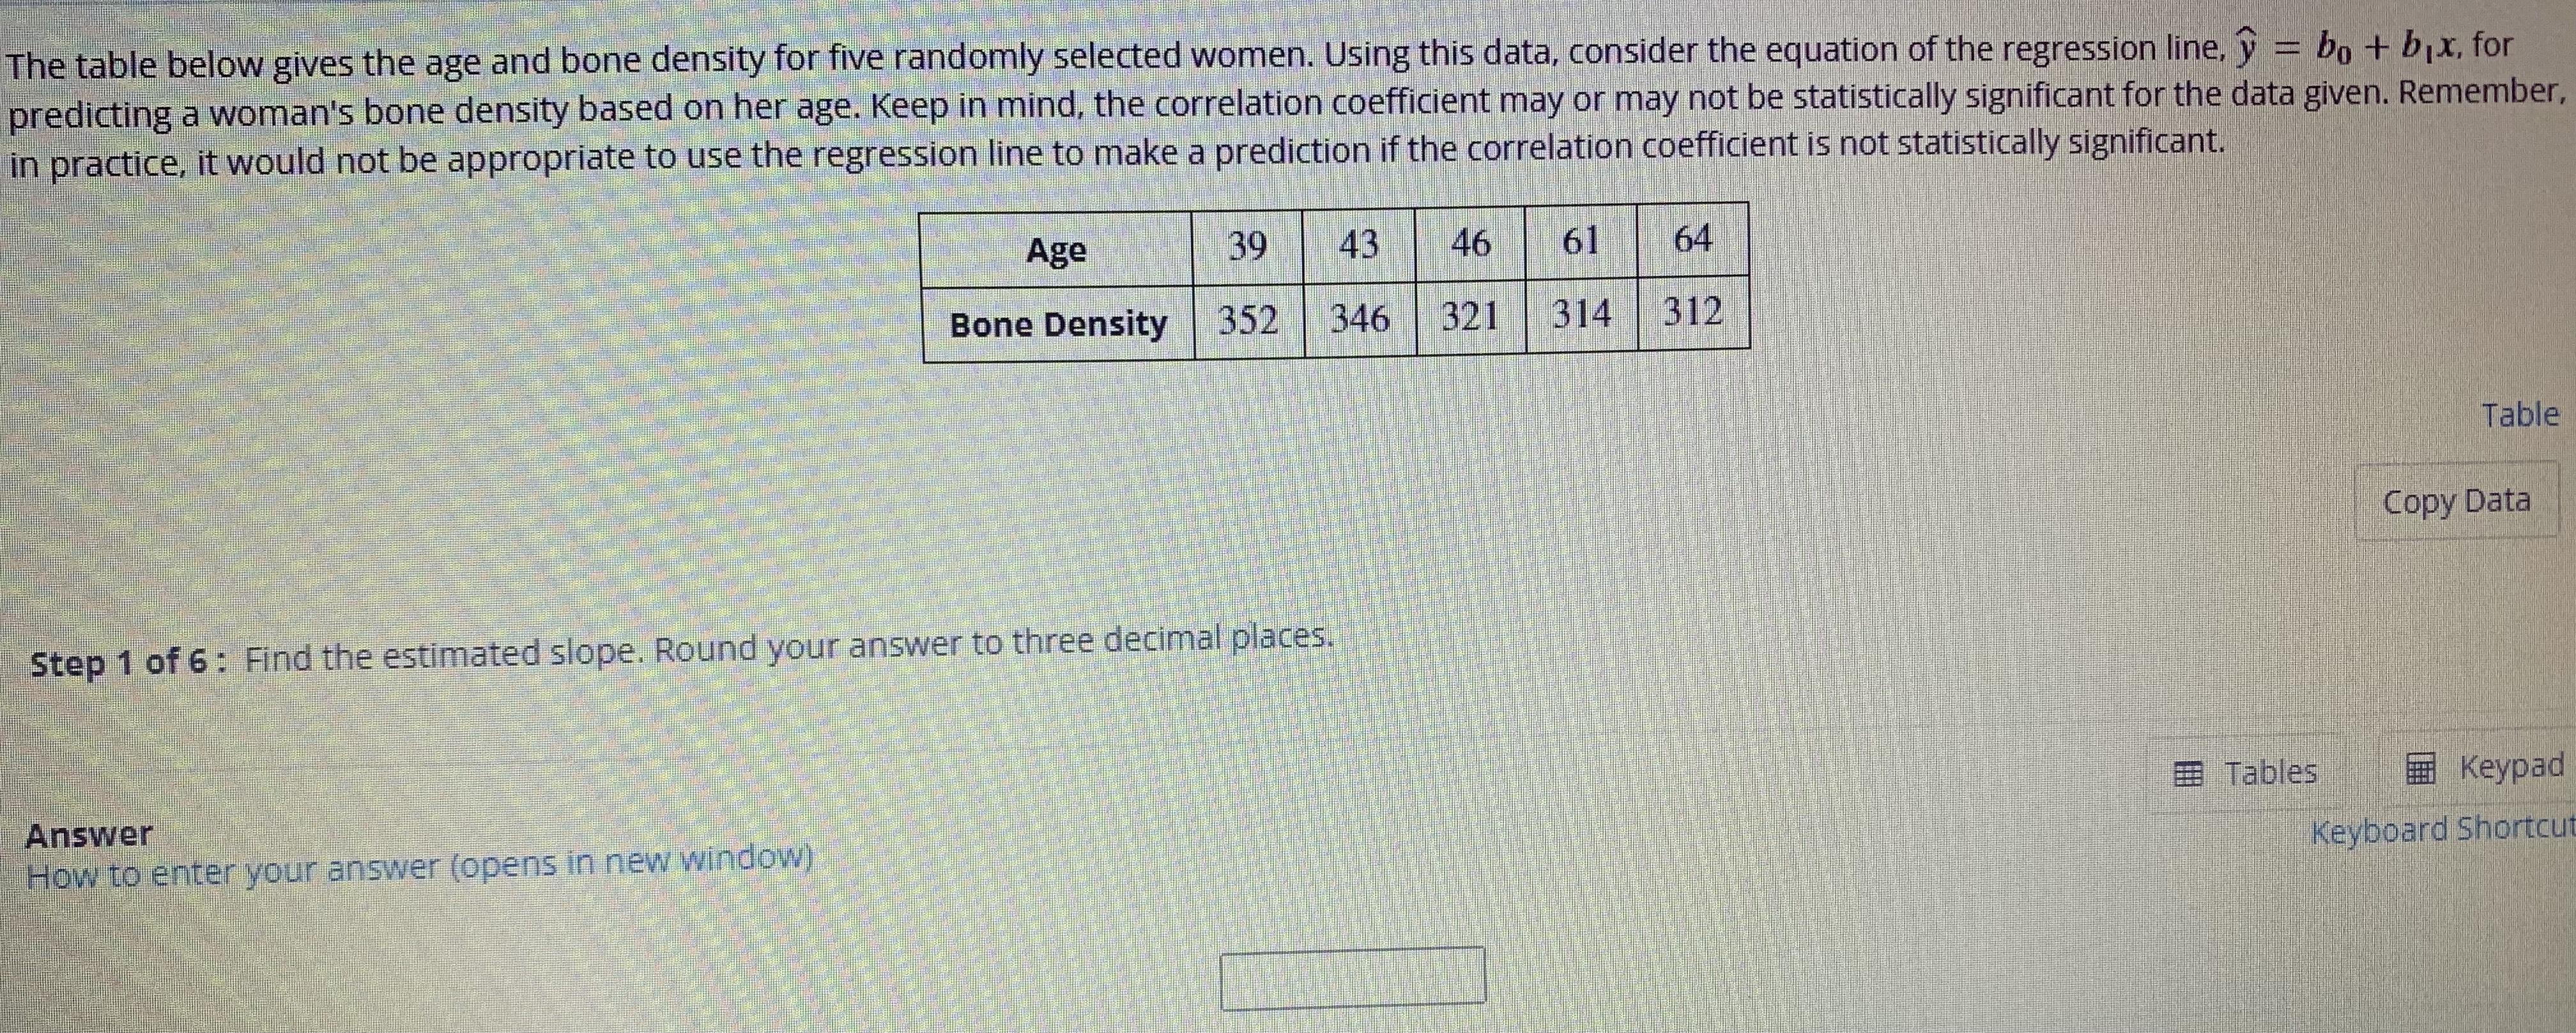

The table below gives the age and bone density for five randomly selected women. Using this data, consider the equation of the regression line, y = bo + bix, for predicting a woman's bone density based on her age. Keep in mind, the correlation coefficient may or may not be statistically significant for the data given. Remember, in practice, it would not be appropriate to use the regression line to make a prediction if the correlation coefficient is not statistically significant. Age 39 43 46 61 64 Bone Density 352 346 321 314 312 Table Copy Data Step 1 of 6 : Find the estimated slope. Round your answer to three decimal places. Tables Keypad Answer How to enter your answer (opens in new window) Keyboard Shortcut
Step by Step Solution
There are 3 Steps involved in it

Get step-by-step solutions from verified subject matter experts