

Question: The table below gives the age and bone density for five randomly selected women. Using this data, consider the equation of the regression line, y
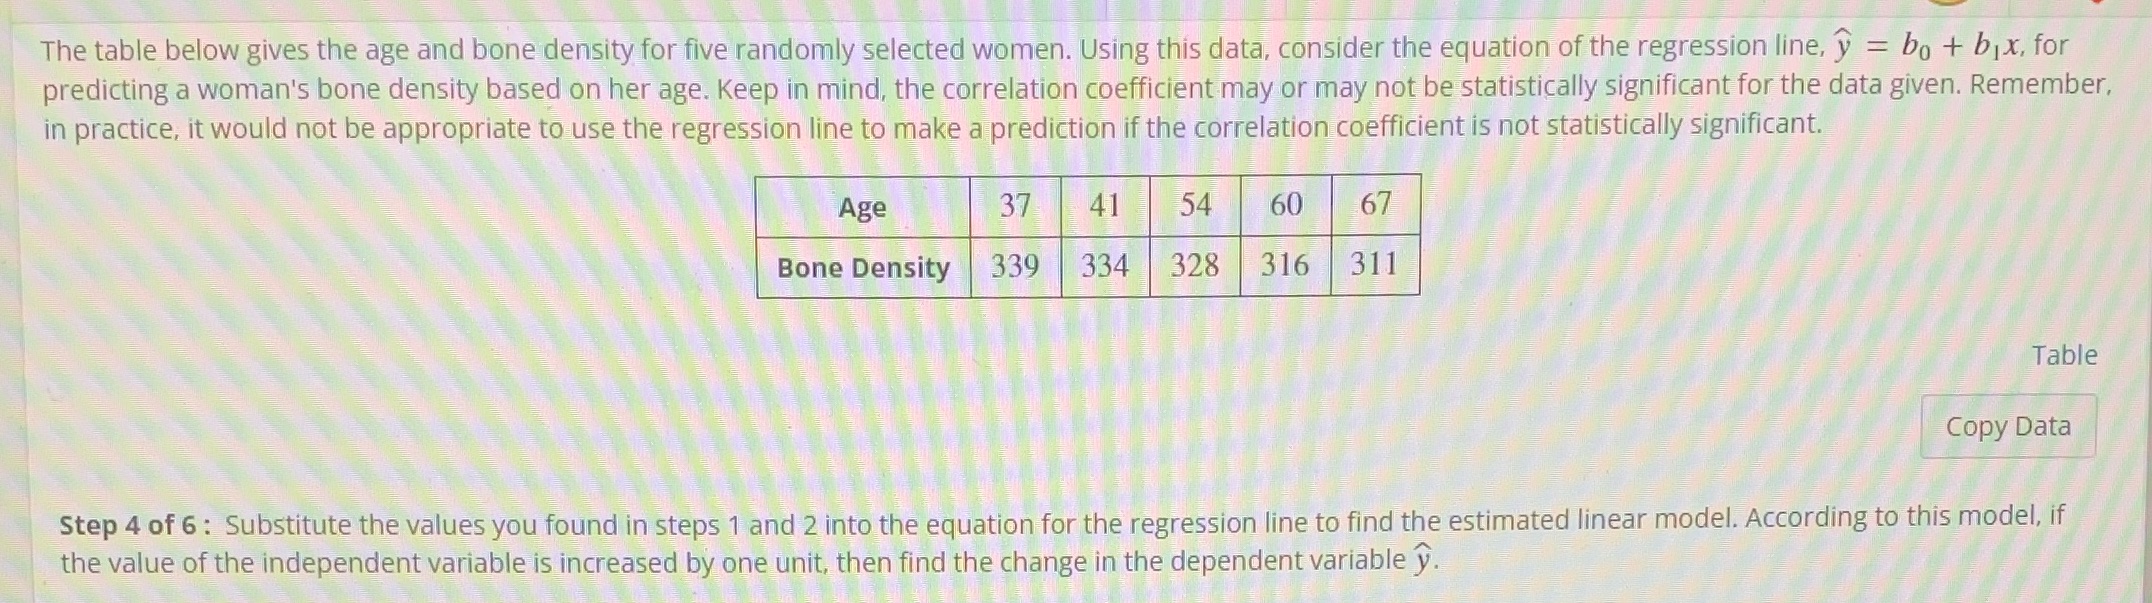
The table below gives the age and bone density for five randomly selected women. Using this data, consider the equation of the regression line, y = bo + bix, for predicting a woman's bone density based on her age. Keep in mind, the correlation coefficient may or may not be statistically significant for the data given. Remember, in practice, it would not be appropriate to use the regression line to make a prediction if the correlation coefficient is not statistically significant. Age 37 41 54 60 67 Bone Density 339 334 328 316 311 Table Copy Data Step 4 of 6 : Substitute the values you found in steps 1 and 2 into the equation for the regression line to find the estimated linear model. According to this model, if the value of the independent variable is increased by one unit, then find the change in the dependent variable y
Step by Step Solution
There are 3 Steps involved in it

Get step-by-step solutions from verified subject matter experts