

Question: The table below has the monthly pricing data for the S&P 500 from 1985 to the end of 2020. Create a series of pivot tables
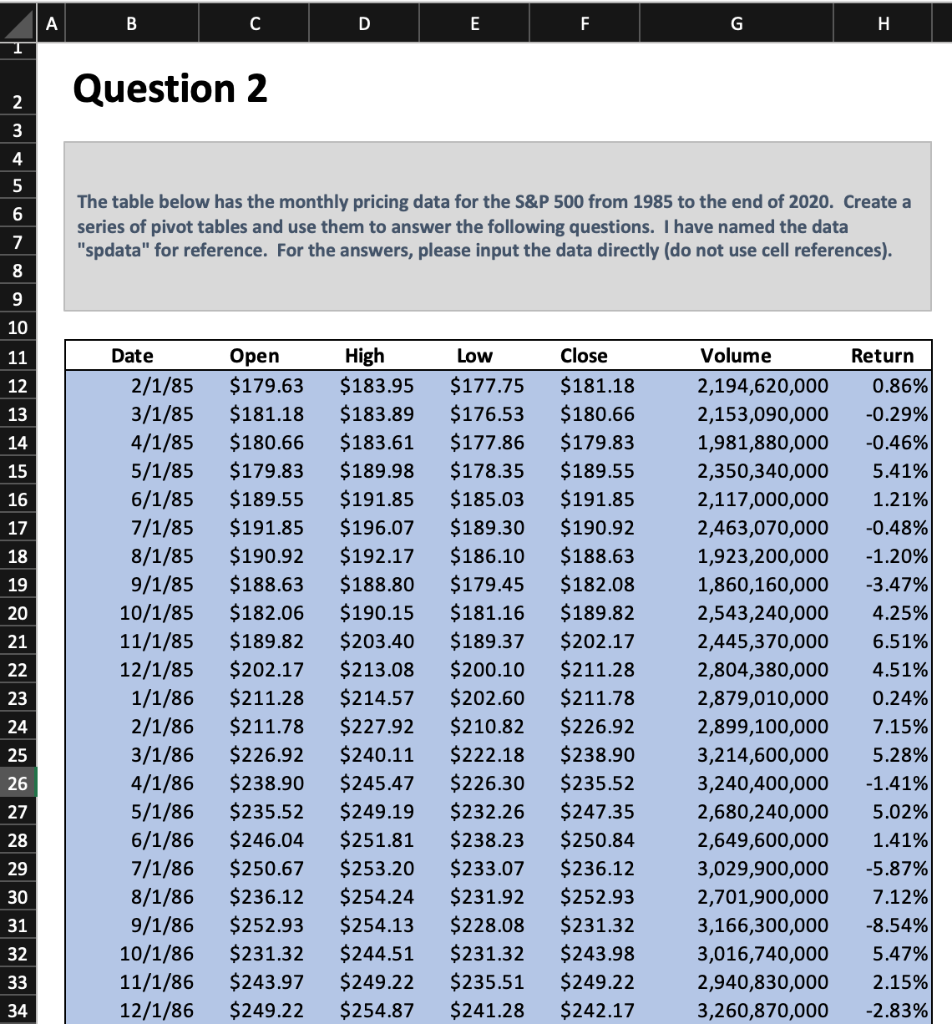
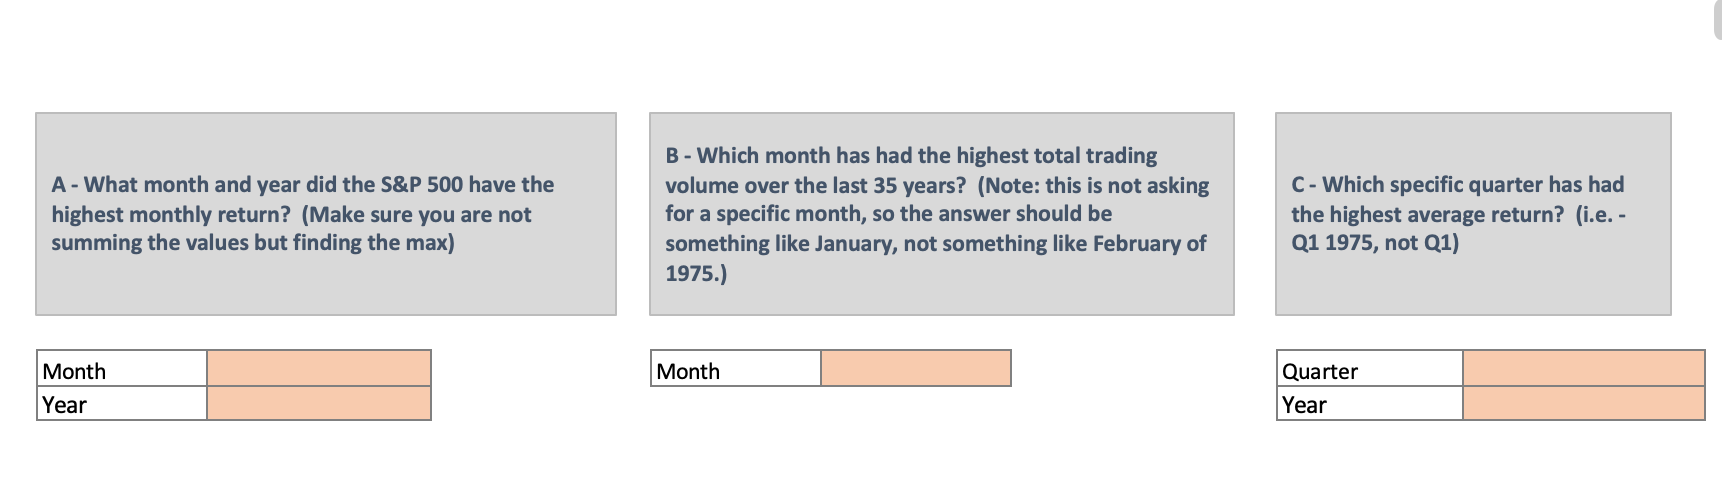
The table below has the monthly pricing data for the S\&P 500 from 1985 to the end of 2020. Create a series of pivot tables and use them to answer the following questions. I have named the data "spdata" for reference. For the answers, please input the data directly (do not use cell references). B - Which month has had the highest total trading A - What month and year did the S\&P 500 have the volume over the last 35 years? (Note: this is not asking C - Which specific quarter has had highest monthly return? (Make sure you are not for a specific month, so the answer should be the highest average return? (i.e. summing the values but finding the max) something like January, not something like February of Q1 1975, not Q1) 1975.)
Step by Step Solution
There are 3 Steps involved in it

Get step-by-step solutions from verified subject matter experts