

Question: The table below has the monthly pricing data for the S&P 500. Create a series of pivot tables and use them to answer the
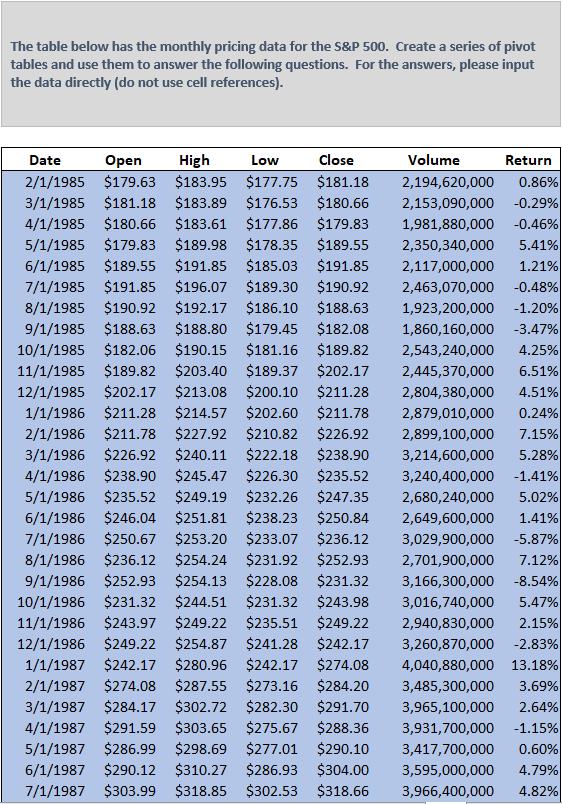
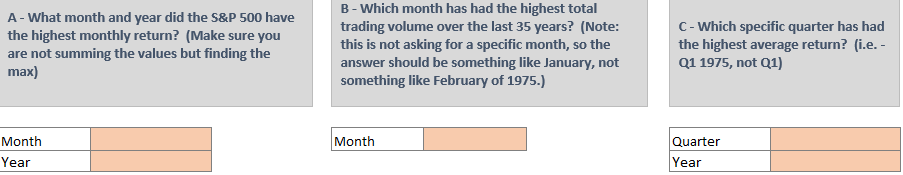
The table below has the monthly pricing data for the S&P 500. Create a series of pivot tables and use them to answer the following questions. For the answers, please input the data directly (do not use cell references). Date Low Close Volume Return $181.18 2,194,620,000 0.86% $180.66 2,153,090,000 -0.29% $179.83 1,981,880,000 -0.46% $189.55 Open High 2/1/1985 $179.63 $183.95 $177.75 3/1/1985 $181.18 $183.89 $176.53 4/1/1985 $180.66 $183.61 $177.86 5/1/1985 $179.83 $189.98 $178.35 6/1/1985 $189.55 $191.85 $185.03 $191.85 7/1/1985 $191.85 $196.07 $189.30 $190.92 8/1/1985 $190.92 $192.17 $186.10 $188.63 9/1/1985 $188.63 $188.80 $179.45 $182.08 10/1/1985 $182.06 $190.15 $181.16 $189.82 11/1/1985 $189.82 $203.40 $189.37 $202.17 12/1/1985 $202.17 $213.08 $200.10 $211.28 1/1/1986 $211.28 $214.57 $202.60 $211.78 2/1/1986 $211.78 $227.92 $210.82 $226.92 3/1/1986 $226.92 $240.11 $222.18 $238.90 4/1/1986 $238.90 $245.47 $226.30 $235.52 5/1/1986 $235.52 $249.19 $232.26 $247.35 6/1/1986 $246.04 $251.81 $238.23 $250.84 7/1/1986 $250.67 $253.20 $233.07 $236.12 8/1/1986 $236.12 $254.24 $231.92 $252.93 9/1/1986 $252.93 $254.13 $228.08 $231.32 10/1/1986 $231.32 $244.51 $231.32 $243.98 11/1/1986 $243.97 $249.22 $235.51 $249.22 12/1/1986 $249.22 $254.87 $241.28 $242.17 1/1/1987 $242.17 $280.96 $242.17 $274.08 2/1/1987 $274.08 $287.55 $273.16 $284.20 3/1/1987 $284.17 $302.72 $282.30 $291.70 4/1/1987 $291.59 $303.65 $275.67 $288.36 5/1/1987 $286.99 $298.69 $277.01 $290.10 6/1/1987 $290.12 $310.27 $286.93 $304.00 7/1/1987 $303.99 $318.85 $302.53 $318.66 2,350,340,000 5.41% 2,117,000,000 1.21% 2,463,070,000 -0.48% 1,923,200,000 -1.20% 1,860,160,000 -3.47% 2,543,240,000 4.25% 2,445,370,000 6.51% 2,804,380,000 4.51% 2,879,010,000 0.24% 2,899,100,000 7.15% 3,214,600,000 5.28% 3,240,400,000 -1.41% 2,680,240,000 5.02% 2,649,600,000 1.41% 3,029,900,000 -5.87% 2,701,900,000 7.12% 3,166,300,000 -8.54% 3,016,740,000 5.47% 2,940,830,000 2.15% 3,260,870,000 -2.83% 4,040,880,000 13.18% 3,485,300,000 3.69% 3,965,100,000 2.64% 3,931,700,000 -1.15% 3,417,700,000 0.60% 3,595,000,000 4.79% 3,966,400,000 4.82% A - What month and year did the S&P 500 have the highest monthly return? (Make sure you are not summing the values but finding the max) B-Which month has had the highest total trading volume over the last 35 years? (Note: this is not asking for a specific month, so the answer should be something like January, not something like February of 1975.) C - Which specific quarter has had the highest average return? (i.e. - Q1 1975, not Q1) Month Year Month Quarter Year
Step by Step Solution
There are 3 Steps involved in it

Get step-by-step solutions from verified subject matter experts