

Question: The table below lists the CPI and wage values for the United States from different decades. a. Complete the table by computing the real
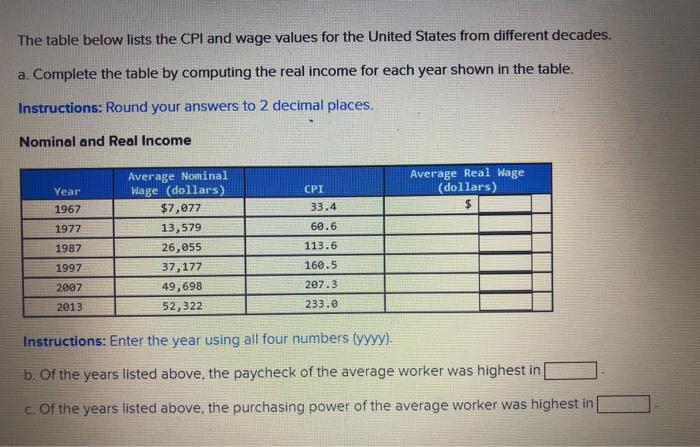
The table below lists the CPI and wage values for the United States from different decades. a. Complete the table by computing the real income for each year shown in the table. Instructions: Round your answers to 2 decimal places.. Nominal and Real Income Year 1967 1977 1987 1997 2007 2013 Average Nominal Wage (dollars) $7,077 13,579 26,055 37,177 49,698 52,322 CPI 33.4 60.6 113.6 160.5 207.3 233.0 Average Real Wage (dollars) Instructions: Enter the year using all four numbers (yyyy). b. Of the years listed above, the paycheck of the average worker was highest in c. Of the years listed above, the purchasing power of the average worker was highest in
Step by Step Solution
3.34 Rating (154 Votes )
There are 3 Steps involved in it
Lets calculate the real income for each year Real Income 1967 Nominal Income CPI 100 7077... View full answer

Get step-by-step solutions from verified subject matter experts