

Question: The table below (on the next page) lists data on the indexes of aggregate final energy demand (Y), real GDP (X), and real energy
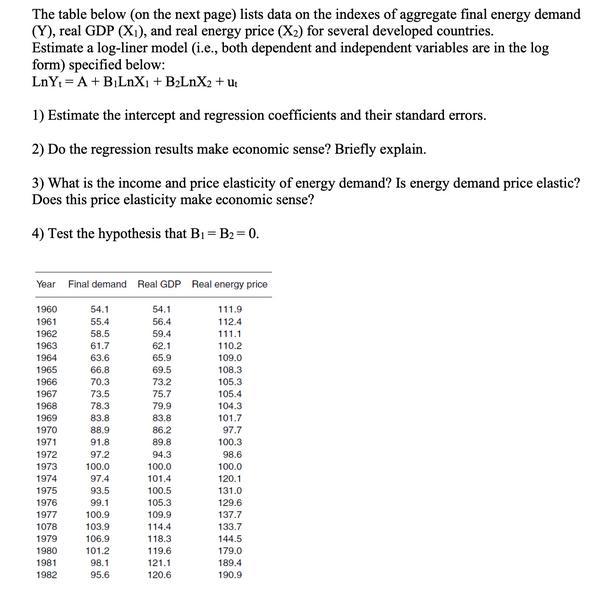
The table below (on the next page) lists data on the indexes of aggregate final energy demand (Y), real GDP (X), and real energy price (X) for several developed countries. Estimate a log-liner model (i.e., both dependent and independent variables are in the log form) specified below: LnY = A + BLnX + BLnX + U 1) Estimate the intercept and regression coefficients and their standard errors. 2) Do the regression results make economic sense? Briefly explain. 3) What is the income and price elasticity of energy demand? Is energy demand price elastic? Does this price elasticity make economic sense? 4) Test the hypothesis that B = B=0. Year Final demand Real GDP Real energy price 1960 1961 1962 1963 1964 1965 1966 1967 1968 1969 1970 1971 1972 1973 1974 1975 1976 1977 1078 1979 1980 1981 1982 54.1 55.4 58.5 61.7 63.6 66.8 70.3 73.5 78.3 83.8 88.9 91.8 97.2 100.0 97.4 93,5 99.1 100.9 103.9 106.9 101.2 98.1 95.6 54.1 56.4 59.4 62.1 65.9 69.5 73.2 75.7 79.9 83.8 86.2 89.8 94.3 100.0 101.4 100.5 105.3 109.9 114.4 118.3 119.6 121.1 120.6 111.9 112.4 111.1 110.2 109.0 108.3 105.3 105.4 104.3 101.7 97.7 100.3 98.6 100.0 120.1 131.0 129.6 137.7 133.7 144.5 179.0 189.4 190.9
Step by Step Solution
There are 3 Steps involved in it
Okay here is my analysis of the loglinear model using the data provided 1 Estimate the intercept and ... View full answer

Get step-by-step solutions from verified subject matter experts