

Question: The table below presents correlation coefficients among US dollar returns, real interest rate, inflation rate, nominal risk-free rate in the US for the past 20
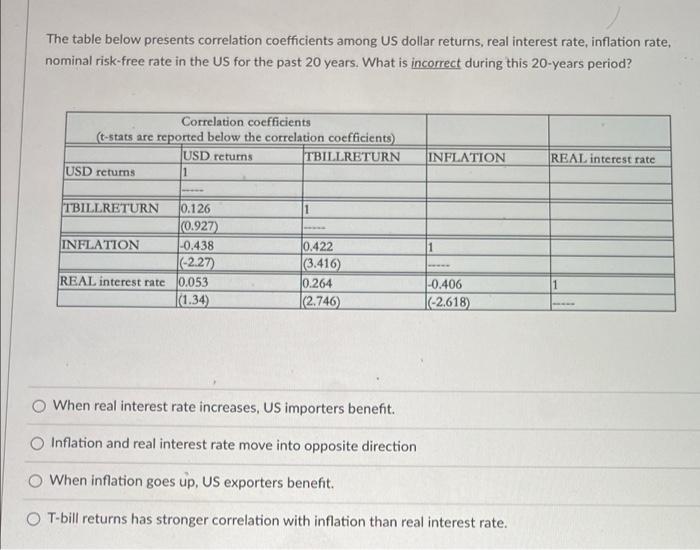
The table below presents correlation coefficients among US dollar returns, real interest rate, inflation rate, nominal risk-free rate in the US for the past 20 years. What is incorrect during this 20-years period? Correlation coefficients (t-stats are reported below the correlation coefficients) USD returns TBILLRETURN USD returns 1 INFLATION REAL interest rate TBILLRETURN 1 INFLATION 10.126 0.927) |-0.438 (-2.27) 10.053 |(1.34) REAL interest rate 0.422 (3.416) 0.264 |(2.746) 1 -0.406 |-2.618) When real interest rate increases, US importers benefit. Inflation and real interest rate move into opposite direction When inflation goes up, US exporters benefit. OT-bill returns has stronger correlation with inflation than real interest rate
Step by Step Solution
There are 3 Steps involved in it

Get step-by-step solutions from verified subject matter experts