

Question: The table below presents two mutually exclusive projects. When we compare the two projects A and B, we can see that there is a potential
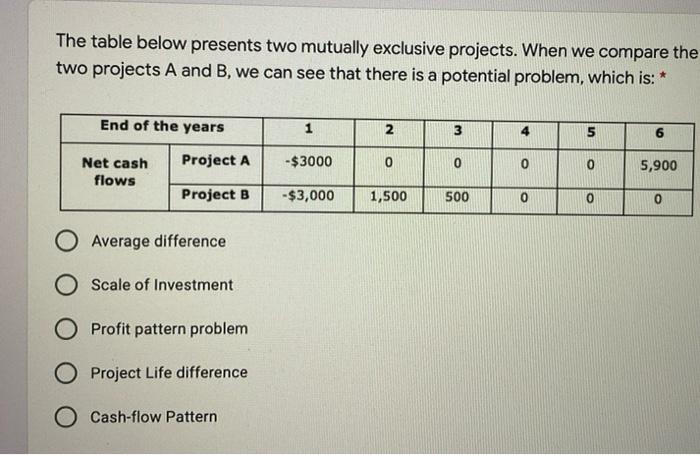
The table below presents two mutually exclusive projects. When we compare the two projects A and B, we can see that there is a potential problem, which is: * End of the years 1 2 3 5 Project A - $3000 0 0 0 Net cash flows 5,900 Project B - $3,000 1,500 500 0 0 O Average difference O Scale of Investment O Profit pattern problem O Project Life difference O Cash-flow Pattern
Step by Step Solution
There are 3 Steps involved in it
1 Expert Approved Answer
Step: 1 Unlock

Question Has Been Solved by an Expert!
Get step-by-step solutions from verified subject matter experts
Step: 2 Unlock
Step: 3 Unlock