

Question: The table below provides a training data set containing nine observations, two predictors (X, and X2), and one qualitative response vanable (Category). X, X -1
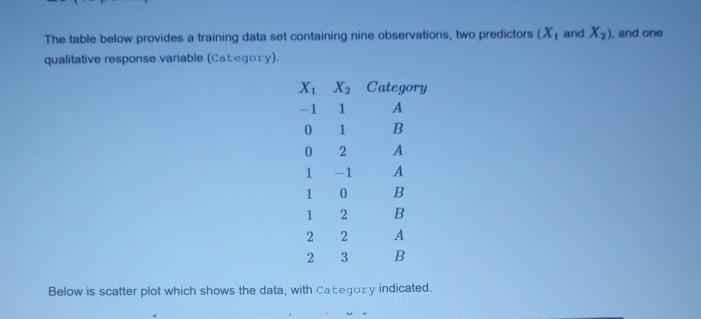
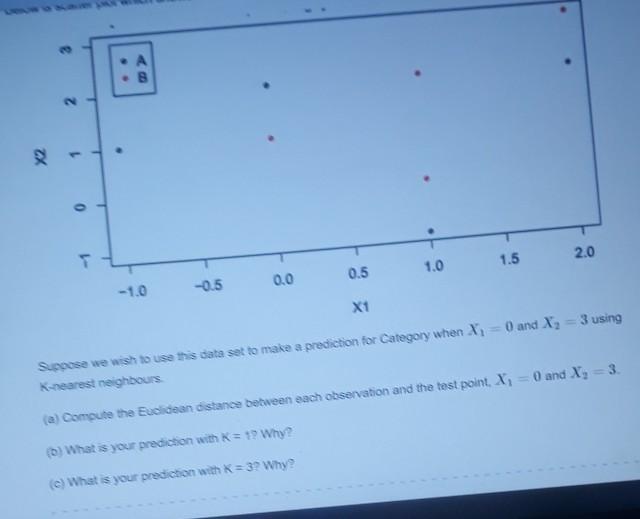
The table below provides a training data set containing nine observations, two predictors (X, and X2), and one qualitative response vanable (Category). X, X -1 1 0 1 0 2 1 -1 1 0 1 2 2 2 2 3 Category B B B B Below is scatter plot which shows the data, with Category indicated & 2 1 0 1.5 2.0 0.5 1.0 -1.0 -0.5 0.0 X1 Suppose we wish to use this data set to make a prediction for Category when X and X, = 3 using K-nearest neighbours (a) Compute the Euclidean distance between each observation and the test point Xi = 0 and X, 3. () What is your prediction with K = 19 Why? (c) What is your prediction with K = 39 Why
Step by Step Solution
There are 3 Steps involved in it
1 Expert Approved Answer
Step: 1 Unlock

Question Has Been Solved by an Expert!
Get step-by-step solutions from verified subject matter experts
Step: 2 Unlock
Step: 3 Unlock