

Question: The table below reports the expected returns and standard deviations of two stocks, as well as their weights in the optimal risky portfolio. The returns
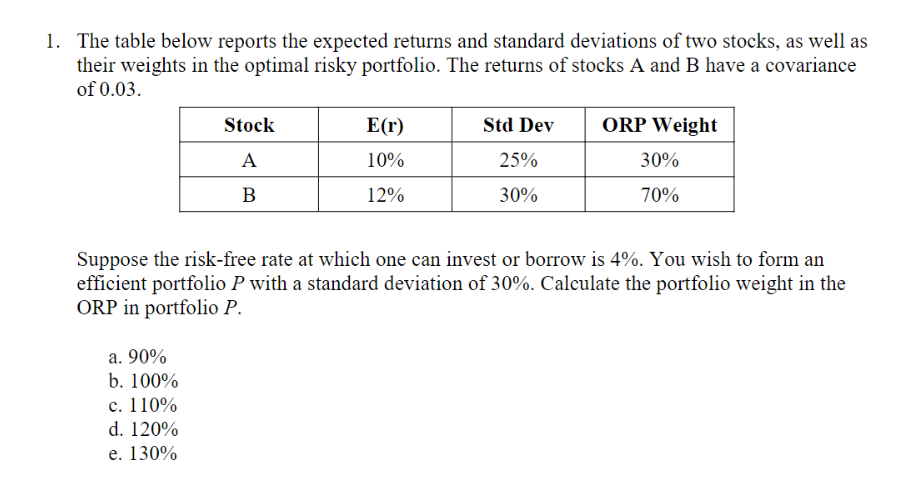
The table below reports the expected returns and standard deviations of two stocks, as well as their weights in the optimal risky portfolio. The returns of stocks A and B have a covariance of 0.03. Suppose the risk-free rate at which one can invest or borrow is 4%. You wish to form an efficient portfolio P with a standard deviation of 30%. Calculate the portfolio weight in the ORP in portfolio P. a. 90% b. 100% c. 110% d. 120% e. 130%
Step by Step Solution
There are 3 Steps involved in it
1 Expert Approved Answer
Step: 1 Unlock

Question Has Been Solved by an Expert!
Get step-by-step solutions from verified subject matter experts
Step: 2 Unlock
Step: 3 Unlock