

Question: The table below represents stocks and their expected returns under each state of the economy. The portfolio's weights are as follows 50% is invested
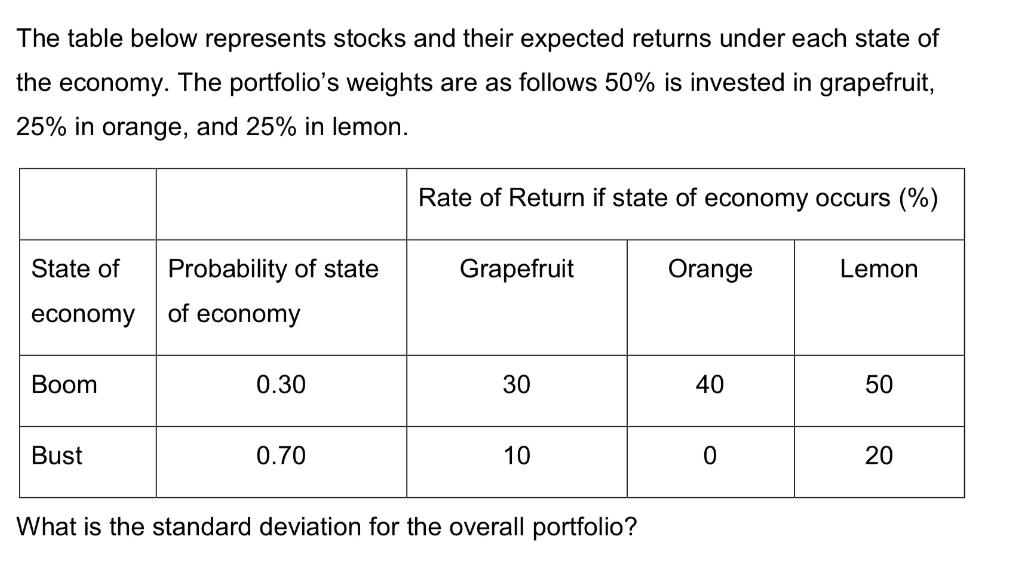
The table below represents stocks and their expected returns under each state of the economy. The portfolio's weights are as follows 50% is invested in grapefruit, 25% in orange, and 25% in lemon. State of Probability of state of economy economy Boom Bust 0.30 0.70 Rate of Return if state of economy occurs (%) Grapefruit 30 10 What is the standard deviation for the overall portfolio? Orange 40 0 Lemon 50 20
Step by Step Solution
3.30 Rating (159 Votes )
There are 3 Steps involved in it
To calculate the standard deviation for the overall portfolio we need to consider the weights of each stock in the portfolio and their corresponding s... View full answer

Get step-by-step solutions from verified subject matter experts