

Question: The table below represents the regression output for a company estimating the cost of material handling. The company has identified that any variable cost
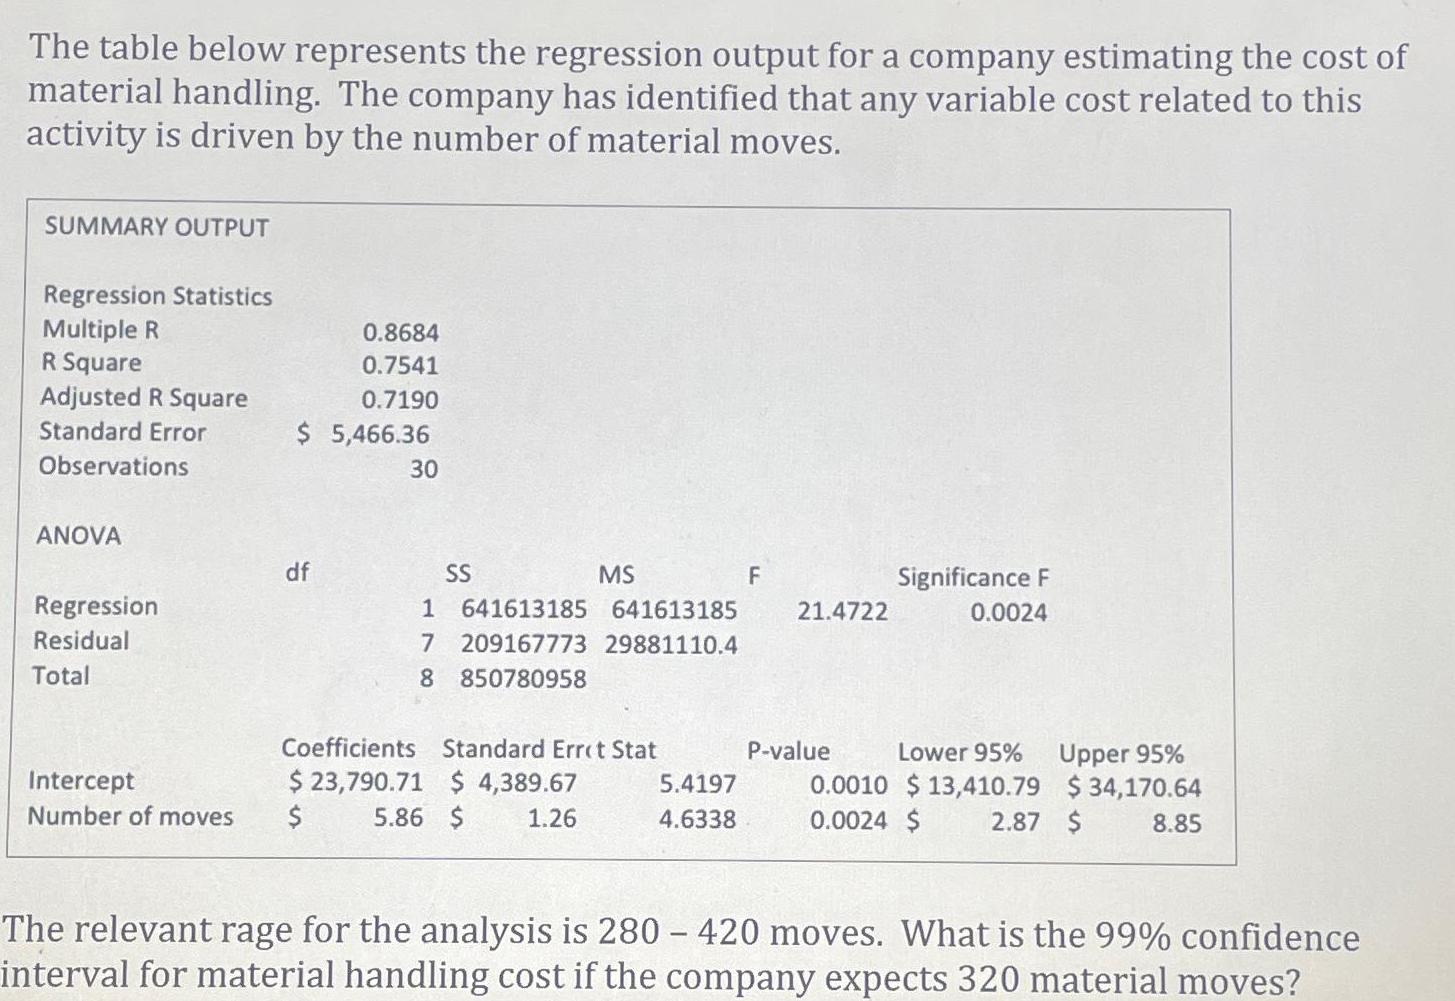
The table below represents the regression output for a company estimating the cost of material handling. The company has identified that any variable cost related to this activity is driven by the number of material moves. SUMMARY OUTPUT Regression Statistics Multiple R 0.8684 R Square 0.7541 Adjusted R Square 0.7190 Standard Error Observations $ 5,466.36 30 ANOVA df SS MS F Regression 1 641613185 641613185 21.4722 Significance F 0.0024 Residual Total 7 209167773 29881110.4 8 850780958 Coefficients Standard Errot Stat P-value Intercept $23,790.71 $ 4,389.67 Number of moves $ 5.86 $ 1.26 5.4197 4.6338 Lower 95% Upper 95% 0.0010 $13,410.79 $34,170.64 0.0024 $ 2.87 $ 8.85 The relevant rage for the analysis is 280 - 420 moves. What is the 99% confidence interval for material handling cost if the company expects 320 material moves?
Step by Step Solution
There are 3 Steps involved in it
Predicting Material Handling Cost with Confidence Interval We can use the provided regression equati... View full answer

Get step-by-step solutions from verified subject matter experts