

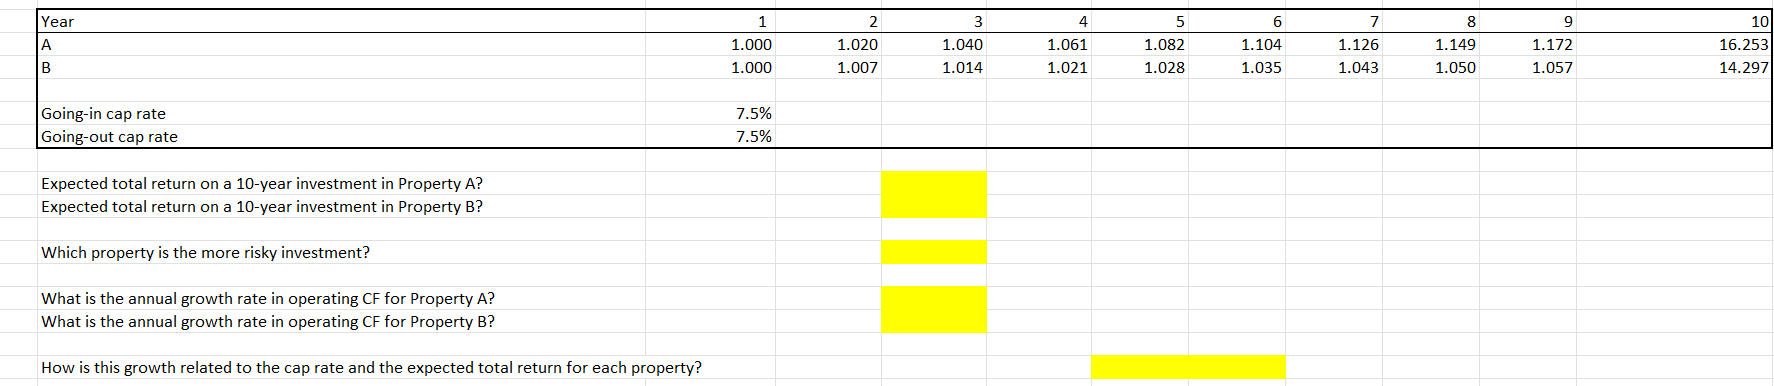
Question: The table below shows 1 0 - year cash flow projections ( in millions, including resale ) for Property A and Property B . Year
The table below shows year cash flow projections in millions, including
resale for Property A and Property B
Year
A
B
a If both properties sell at cap rates of percent goingin and goingout what
is the expected total return on a year investment in each property?
b If the market cap rates represent fair market values, which property is the more
risky investment? How do you know explain your reasoning
c What is the annual growth rate in operating cash flows for each property during
the first nine years?
d How is this growth related to the cap rate and your expected total return for each poperty?
Step by Step Solution
There are 3 Steps involved in it
1 Expert Approved Answer
Step: 1 Unlock

Question Has Been Solved by an Expert!
Get step-by-step solutions from verified subject matter experts
Step: 2 Unlock
Step: 3 Unlock