

Question: The table below shows activities in a project and which ones are on the critical path. Time is given in months, and amounts in NOK.
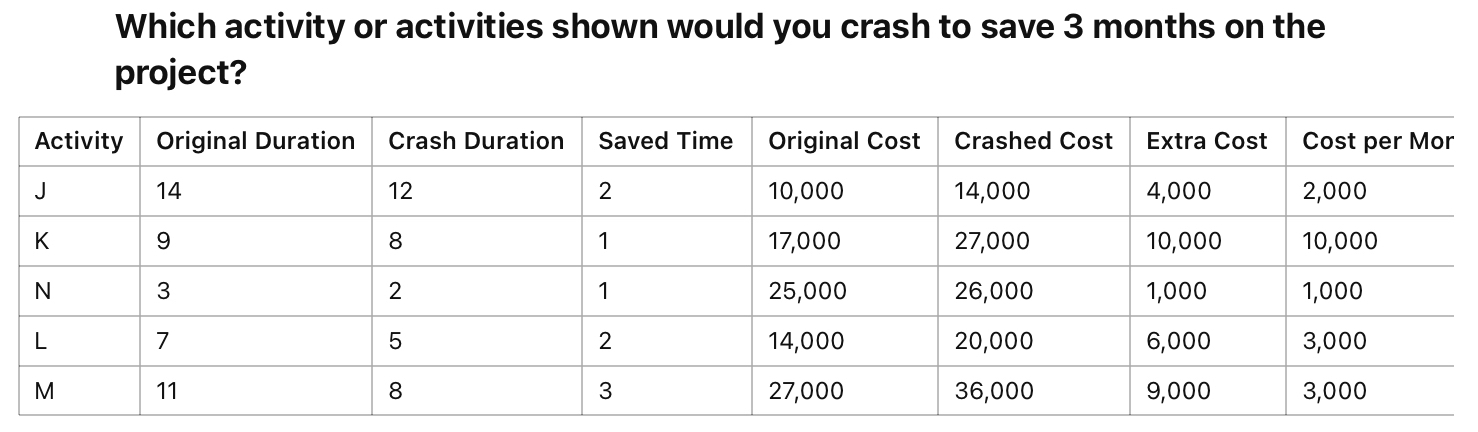
The table below shows activities in a project and which ones are on the critical path. Time is given in months, and amounts in NOK. The project has a float of months. Which activity or activities shown would you crash to save months on the project?Which activity or activities shown would you crash to save months on the project?
tableActivityOriginal Duration,Crash Duration,Saved Time,Original Cost,Crashed Cost,Extra Cost,Cost per MorJKNLM
Step by Step Solution
There are 3 Steps involved in it
1 Expert Approved Answer
Step: 1 Unlock

Question Has Been Solved by an Expert!
Get step-by-step solutions from verified subject matter experts
Step: 2 Unlock
Step: 3 Unlock