

Question: The table below shows data on quantity demanded for ATV tours at an ATV excursion company in Bali. In June, many tourists arrive in Bali,
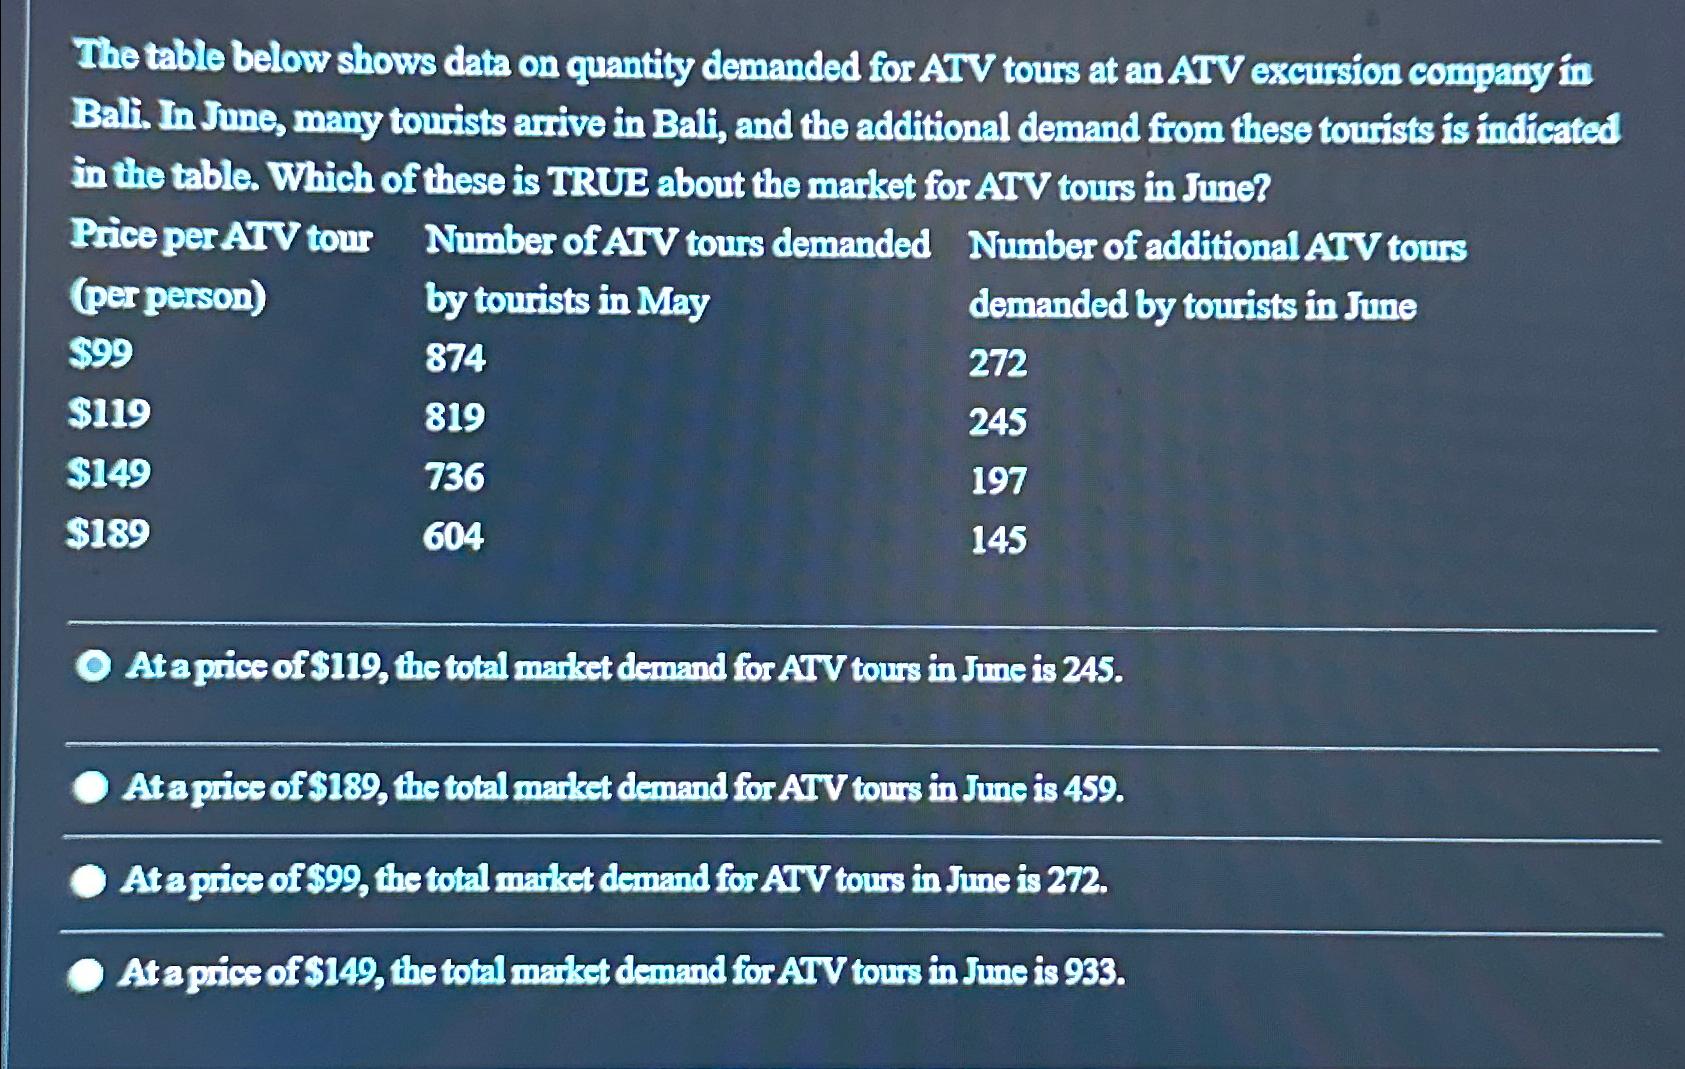
The table below shows data on quantity demanded for ATV tours at an ATV excursion company in Bali. In June, many tourists arrive in Bali, and the additional demand from these tourists is indicated in the table. Which of these is TRUE about the market for ATV tours in June?
tablePrice per ATV tour,Number of ATV tours demanded,Number of additional ATV toursper personby tourists in May,demanded by tourists in June$$$$
At a price of the total manket demand for AIV V tours in June is
At a price of $ the total manket demand for AIV tours in June is
At a price of the total makket demand for ArV tours in June is
At a price of the total market demand for AIV tours in June is
Step by Step Solution
There are 3 Steps involved in it
1 Expert Approved Answer
Step: 1 Unlock

Question Has Been Solved by an Expert!
Get step-by-step solutions from verified subject matter experts
Step: 2 Unlock
Step: 3 Unlock