

Question: The table below shows standard deviations and correlation coefficients for eight stocks from different countries. Calculate the variance of a portfolio with equal investments in
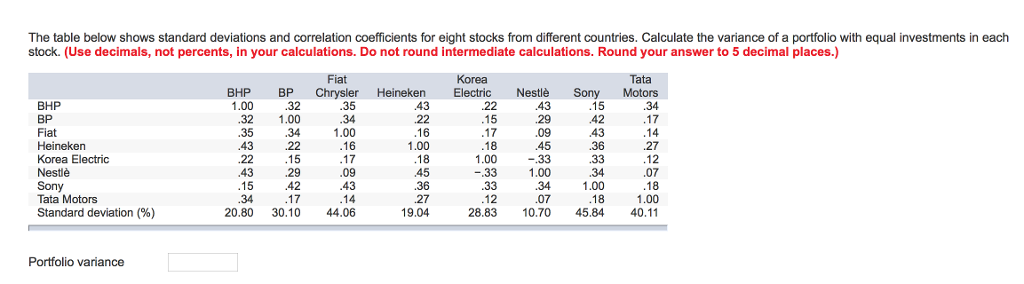
The table below shows standard deviations and correlation coefficients for eight stocks from different countries. Calculate the variance of a portfolio with equal investments in each stock. (Use decimals, not percents, in your calculations. Do not round intermediate calculations. Round your answer to 5 decimal places.) Fiat BHP BP Chrysler HeinekenElectric NestlSonyMotors Heineken Korea Electric 1.00 1.00 28.83 10.70 45.84 40.11 Standard deviation (%) 20.80 30.10 44.06 Portfolio variance
Step by Step Solution
There are 3 Steps involved in it
1 Expert Approved Answer
Step: 1 Unlock

Question Has Been Solved by an Expert!
Get step-by-step solutions from verified subject matter experts
Step: 2 Unlock
Step: 3 Unlock