

Question: The table below shows standard deviations and correlation coefficients for eight stocks from different countries. Calculate the variance of a portfolio with equal investments in
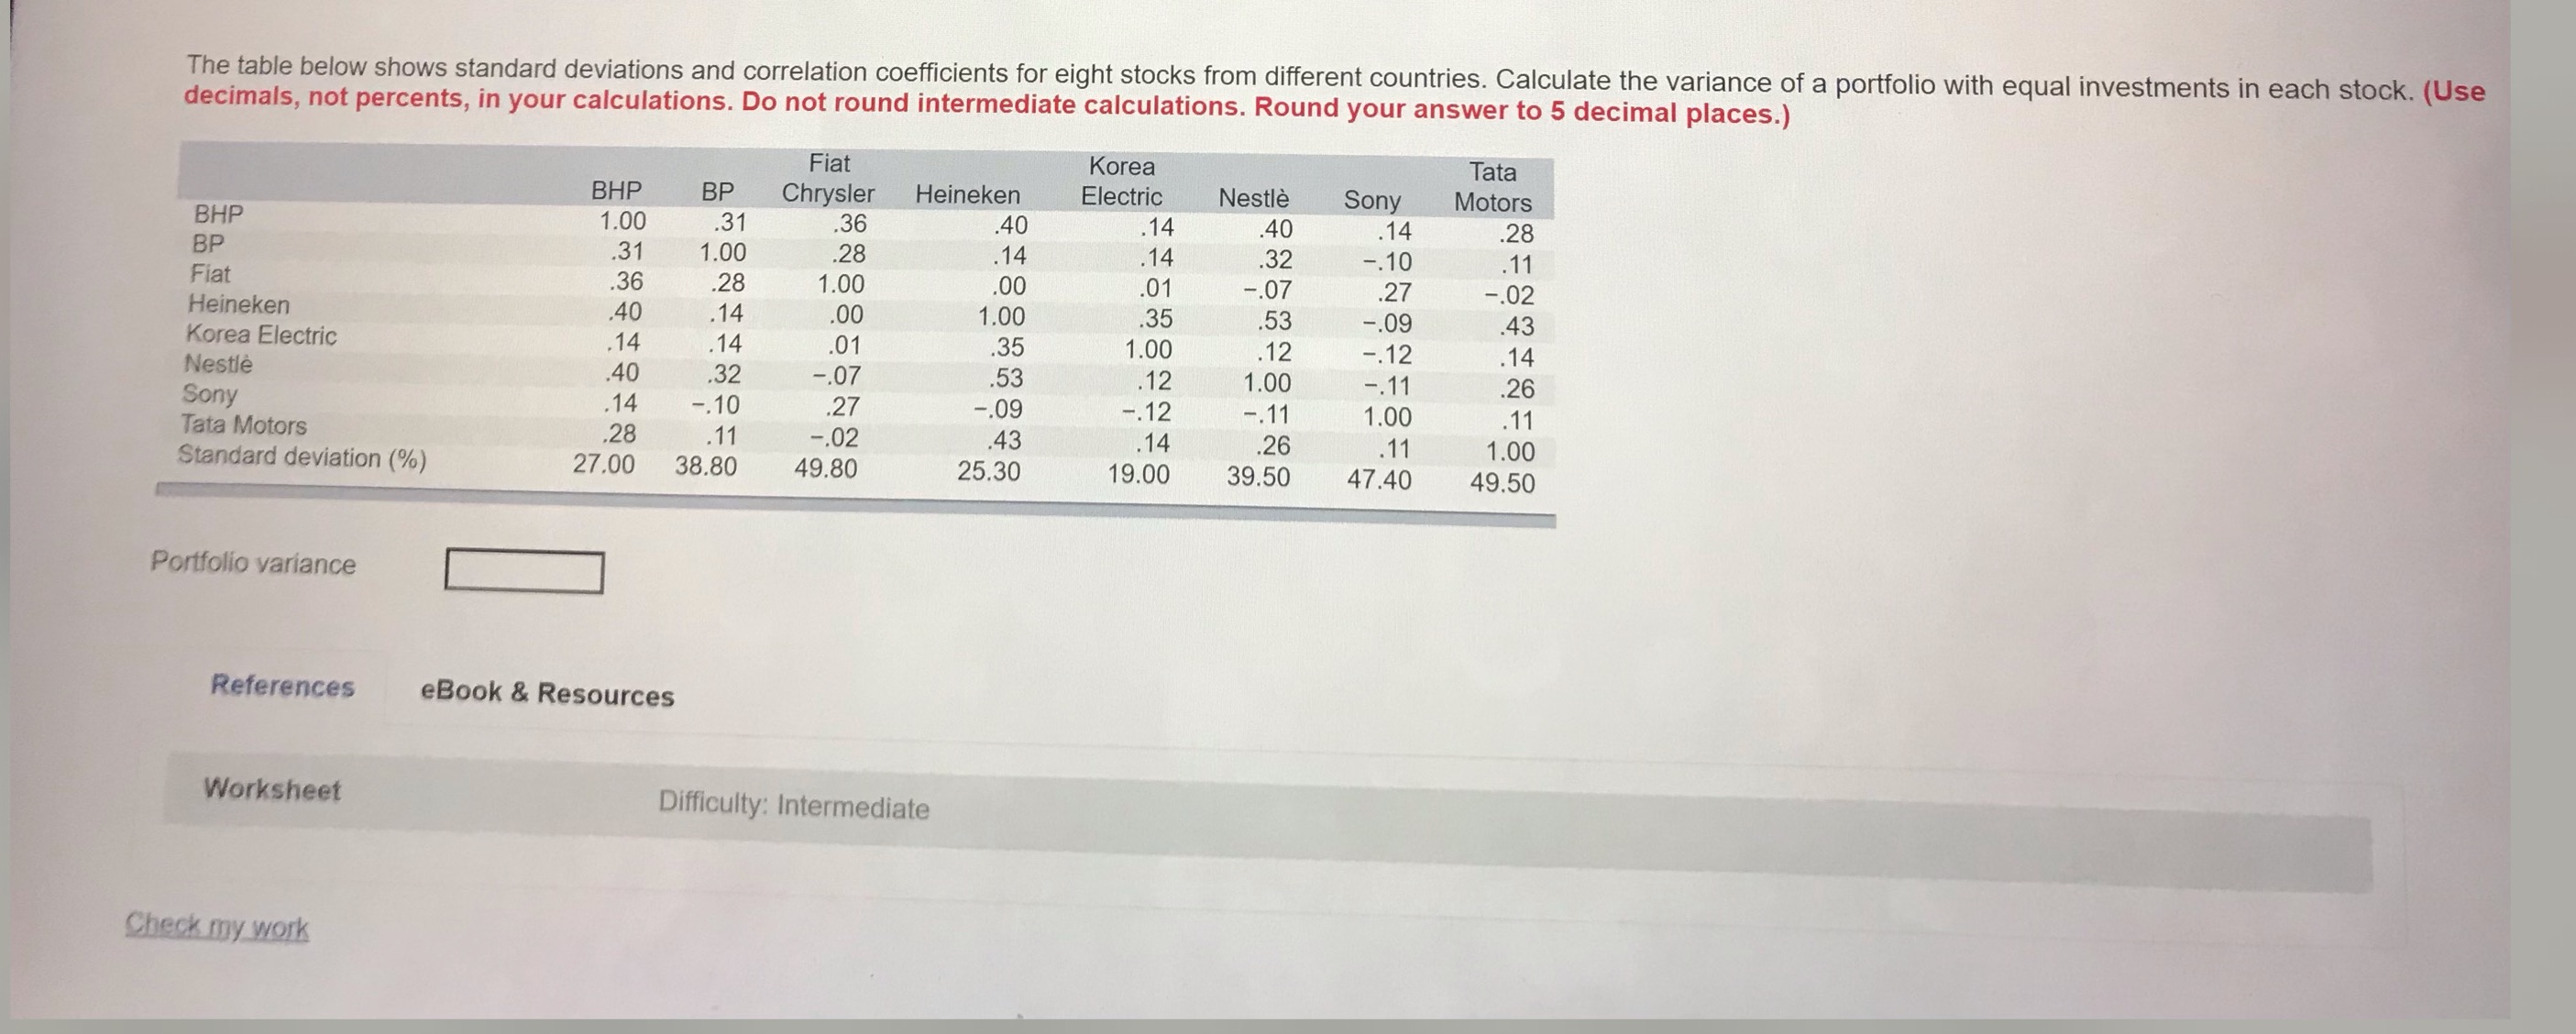

The table below shows standard deviations and correlation coefficients for eight stocks from different countries. Calculate the variance of a portfolio with equal investments in each stock. (Use decimals, not percents, in your calculations. Do not round intermediate calculations. Round your answer to 5 decimal places.) Fiat BHP BHP BP Korea Chrysler Heineken Electric Tata Nestle Sony Motors BP 1.00 .31 36 40 . 14 .31 1.00 .28 40 14 28 Fiat .14 . 14 .28 32 Heineken .36 1.00 -.10 00 . 11 .01 40 -.07 00 .27 Korea Electric .14 1.00 .35 -.02 . 14 .53 .14 -.09 .01 35 43 Nestle 1.00 .12 -.12 .14 Sony .40 .32 -.07 53 .14 12 1.00 Tata Motors -.10 .27 -.09 -.11 .26 Standard deviation (%) 28 -.11 . 11 -.12 1.00 -.02 . 11 27.00 .43 38.80 .14 26 49.80 25.30 .11 19.00 39.50 1.00 47.40 49.50 Portfolio variance References eBook & Resources Worksheet Difficulty: Intermediate Check my work
Step by Step Solution
There are 3 Steps involved in it

Get step-by-step solutions from verified subject matter experts