

Question: The table below shows the annual change in the average nominal wage and inflation rate since 2008. a. Compute the percentage change in real
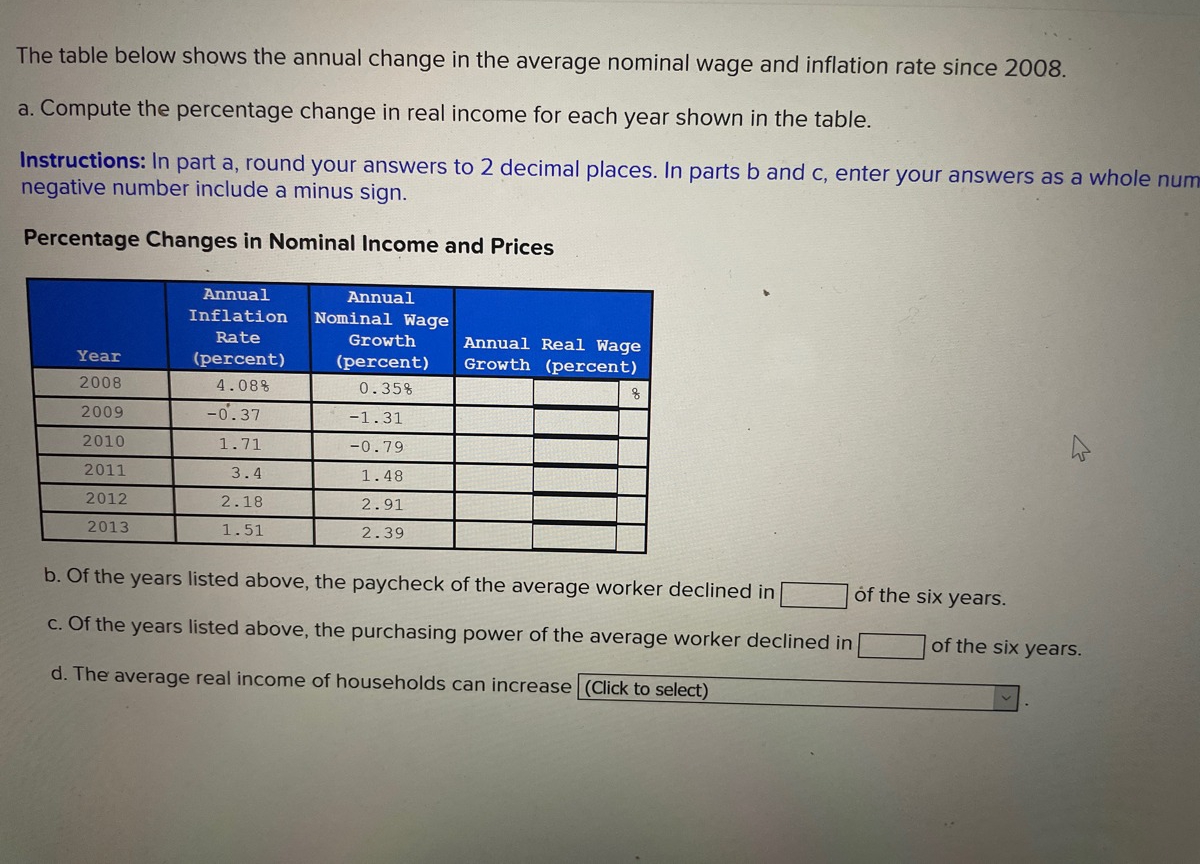
The table below shows the annual change in the average nominal wage and inflation rate since 2008. a. Compute the percentage change in real income for each year shown in the table. Instructions: In part a, round your answers to 2 decimal places. In parts b and c, enter your answers as a whole num negative number include a minus sign. Percentage Changes in Nominal Income and Prices Year Annual Inflation Rate (percent) Annual Nominal Wage Growth (percent) Annual Real Wage Growth (percent) 2008 4.08% 0.35% 8 2009 -0.37 -1.31 2010 1.71 -0.79 2011 3.4 1.48 2012 2.18 2.91 2013 1.51 2.39 b. Of the years listed above, the paycheck of the average worker declined in | c. Of the years listed above, the purchasing power of the average worker declined in d. The average real income of households can increase (Click to select) of the six years. I of the six years.
Step by Step Solution
There are 3 Steps involved in it

Get step-by-step solutions from verified subject matter experts