

Question: The table below shows the annual change in the average nominal wage and inflation rate since 2 0 0 8 . a . Compute the
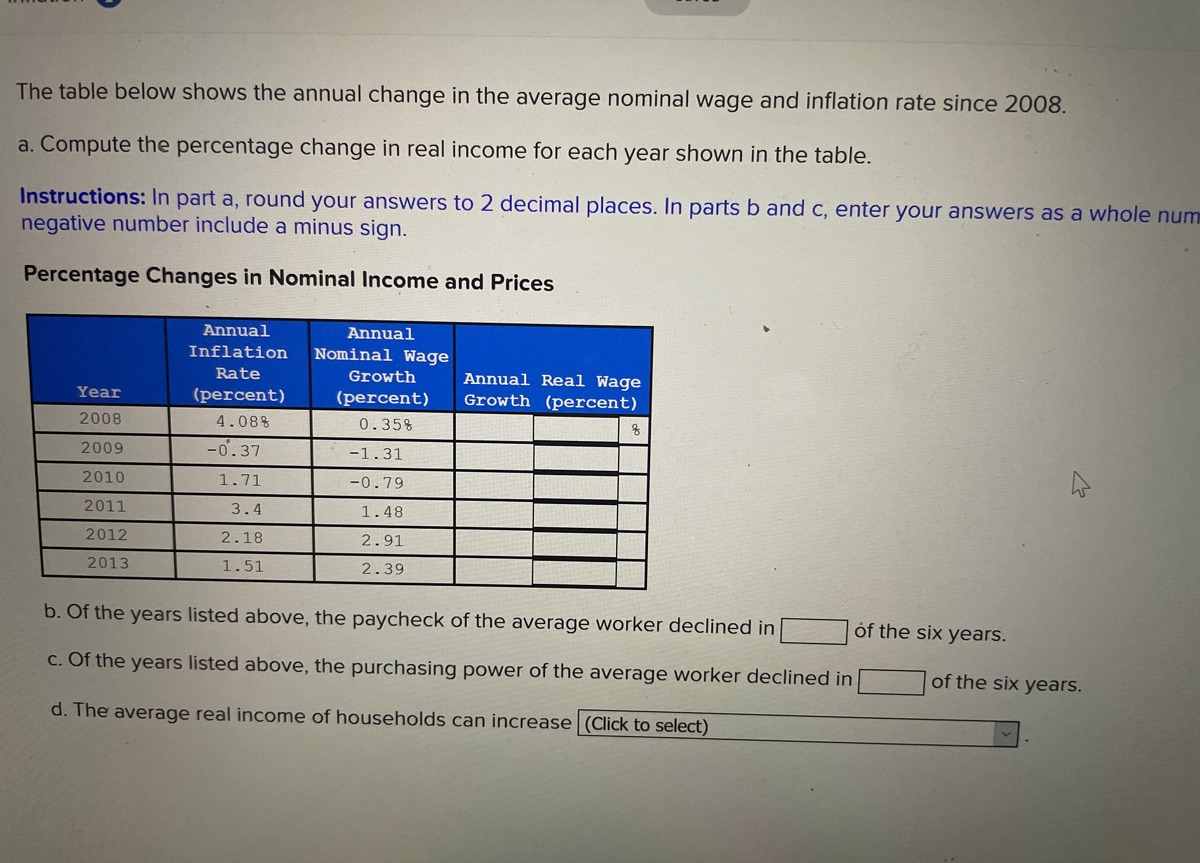
The table below shows the annual change in the average nominal wage and inflation rate since
a Compute the percentage change in real income for each year shown in the table.
Instructions: In part a round your answers to decimal places. In parts b and c enter your answers as a whole num negative number include a minus sign.
Percentage Changes in Nominal Income and Prices
tabletableAnnualInflationRatepercenttableAnnualNominal WageGrowthpercenttableAnnual Real WageGrowthpercent
b Of the years listed above, the paycheck of the average worker declined in of the six years.
c Of the years listed above, the purchasing power of the average worker declined in of the six years.
d The average real income of households can increase
Step by Step Solution
There are 3 Steps involved in it
1 Expert Approved Answer
Step: 1 Unlock

Question Has Been Solved by an Expert!
Get step-by-step solutions from verified subject matter experts
Step: 2 Unlock
Step: 3 Unlock