

Question: The table below shows the average weekly wages(in dollars) for state government employees and federal government employees for 10 years. The table below shows the
The table below shows the average weekly wages(in dollars) for state government employees and federal government employees for 10 years.
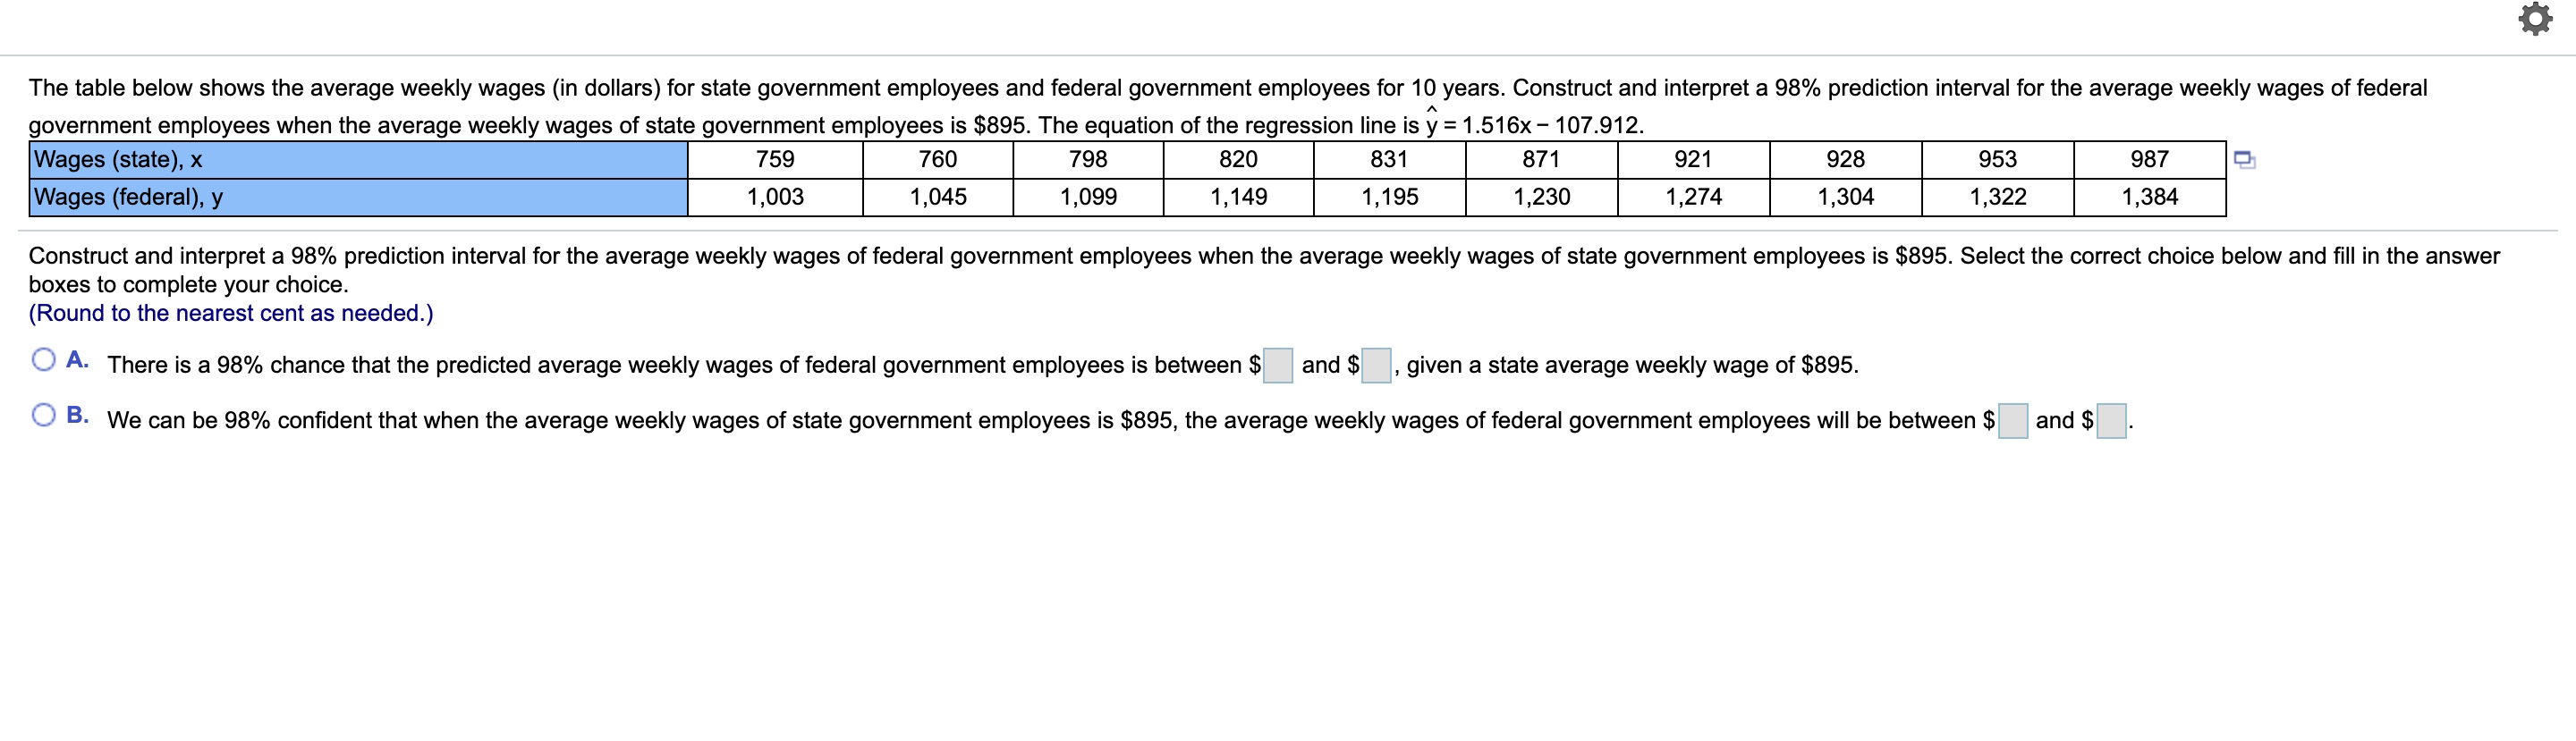
The table below shows the average weekly wages (in dollars) for state government employees and federal government employees for 10 years. Construct and interpret a 98% prediction interval for the average weekly wages of federal government employees when the average weekly wages of state government employees is $895. The equation of the regression line is y = 1.516x - 107.912. 759 760 798 820 831 871 921 928 953 987 Q 1,003 1,045 1,099 1,149 1,195 1,230 1,274 1,304 1,322 1,384 Construct and interpret a 98% prediction interval for the average weekly wages of federal government employees when the average weekly wages of state government employees is $895. Select the correct choice below and fill in the answer boxes to complete your choice. (Round to the nearest cent as needed.) O A- There is a 95% chance that the predicted average weekly wages offederal government employees is between 5 and $ , given a state average weekly wage of $595. O B- We can be 98% condent that when the average weekly wages of state government employees is $595, the average weekly wages of federal government employees will be between $ and $
Step by Step Solution
There are 3 Steps involved in it

Get step-by-step solutions from verified subject matter experts