

Question: The table below shows the crash time (in weeks) and crash cost (in RM) for each activity in the project: Activity Crash Time (week) Crash
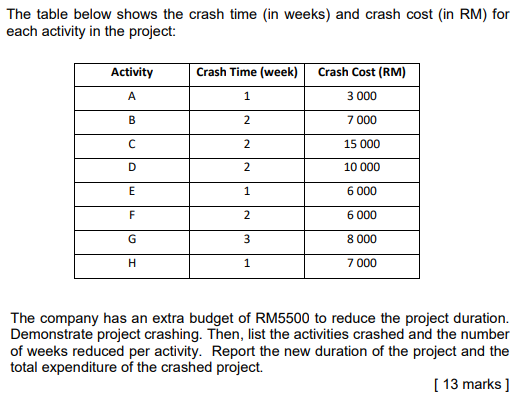
The table below shows the crash time (in weeks) and crash cost (in RM) for each activity in the project: Activity Crash Time (week) Crash Cost (RM) 3 000 A 1 B 2 7 000 2 D 2 E 1 15 000 10 000 6 000 6 000 8 000 7 000 F 2 G 3 H 1 The company has an extra budget of RM5500 to reduce the project duration. Demonstrate project crashing. Then, list the activities crashed and the number of weeks reduced per activity. Report the new duration of the project and the total expenditure of the crashed project. [ 13 marks ] The table below shows the crash time (in weeks) and crash cost (in RM) for each activity in the project: Activity Crash Time (week) Crash Cost (RM) 3 000 A 1 B 2 7 000 2 D 2 E 1 15 000 10 000 6 000 6 000 8 000 7 000 F 2 G 3 H 1 The company has an extra budget of RM5500 to reduce the project duration. Demonstrate project crashing. Then, list the activities crashed and the number of weeks reduced per activity. Report the new duration of the project and the total expenditure of the crashed project. [ 13 marks ]
Step by Step Solution
There are 3 Steps involved in it

Get step-by-step solutions from verified subject matter experts