

Question: The table below shows the demand for a particular brand of fax machine in a department store in each of the last twelve months. Month
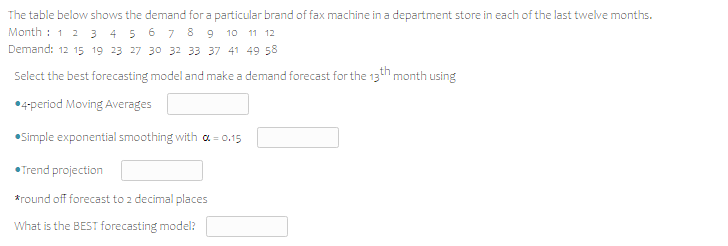
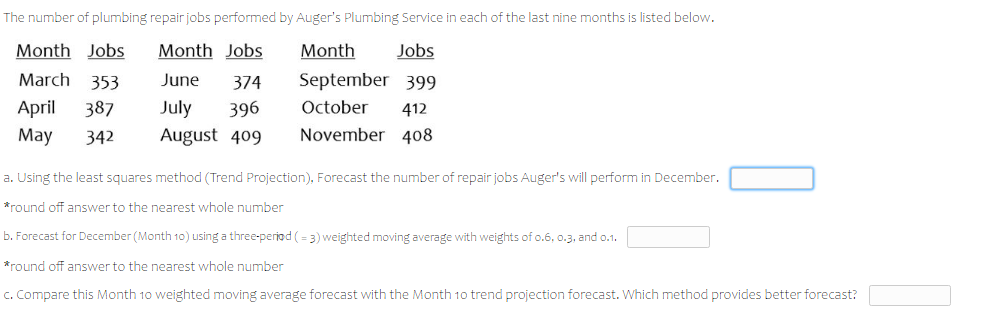
The table below shows the demand for a particular brand of fax machine in a department store in each of the last twelve months. Month : 1 2 3 4 5 6 7 8 9 10 11 12 Demand: 12 15 19 23 27 30 32 33 37 41 49 58 Select the best forecasting model and make a demand forecast for the 13 month using #4-period Moving Averages "Simple exponential smoothing with o =0.15 .Trend projection *round off forecast to 2 decimal places What is the BEST forecasting model?The number of plumbing repair jobs performed by Auger's Plumbing Service in each of the last nine months is listed below. Month Jobs Month Jobs Month Jobs March 353 June 374 September 399 April 387 July 396 October 412 May 342 August 409 November 408 a. Using the least squares method (Trend Projection), Forecast the number of repair jobs Auger's will perform in December. *round off answer to the nearest whole number b. Forecast for December (Month 10) using a three-period ( = 3) weighted moving average with weights of 0.6, 0.3, and 0.1. *round off answer to the nearest whole number c. Compare this Month 10 weighted moving average forecast with the Month 10 trend projection forecast. Which method provides better forecast
Step by Step Solution
There are 3 Steps involved in it

Get step-by-step solutions from verified subject matter experts