

The table below shows the frequency distribution of the rainfall on 52 consecutive Wednesdays in a certain
Fantastic news! We've Found the answer you've been seeking!
Question:
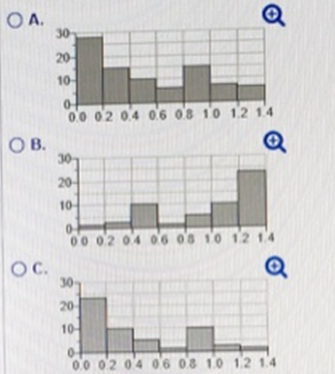
The table below shows the frequency distribution of the rainfall on 52 consecutive Wednesdays in a certain city. Use the frequency distribution to construct a histogram. Do the data appear to have a distribution that is approxiamately normal?
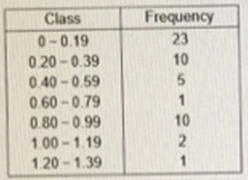
Choose the correct histogram below.
Do the data appear to have a distribution that is approximately normal?
A. No, it has no obvious maximum.
B. Yes, it is approximately normal.
C. No, it is not symmetric.
D. No, it is approximately uniform.
Expert Answer:

Related Book For 

Fundamentals of Corporate Finance
ISBN: 978-0077861629
8th edition
Authors: Richard Brealey, Stewart Myers, Alan Marcus
Posted Date:
