

Question: The table below shows the inventory - sales ratio for manufacturing and trade for a region over a period of 8 years. Use the method
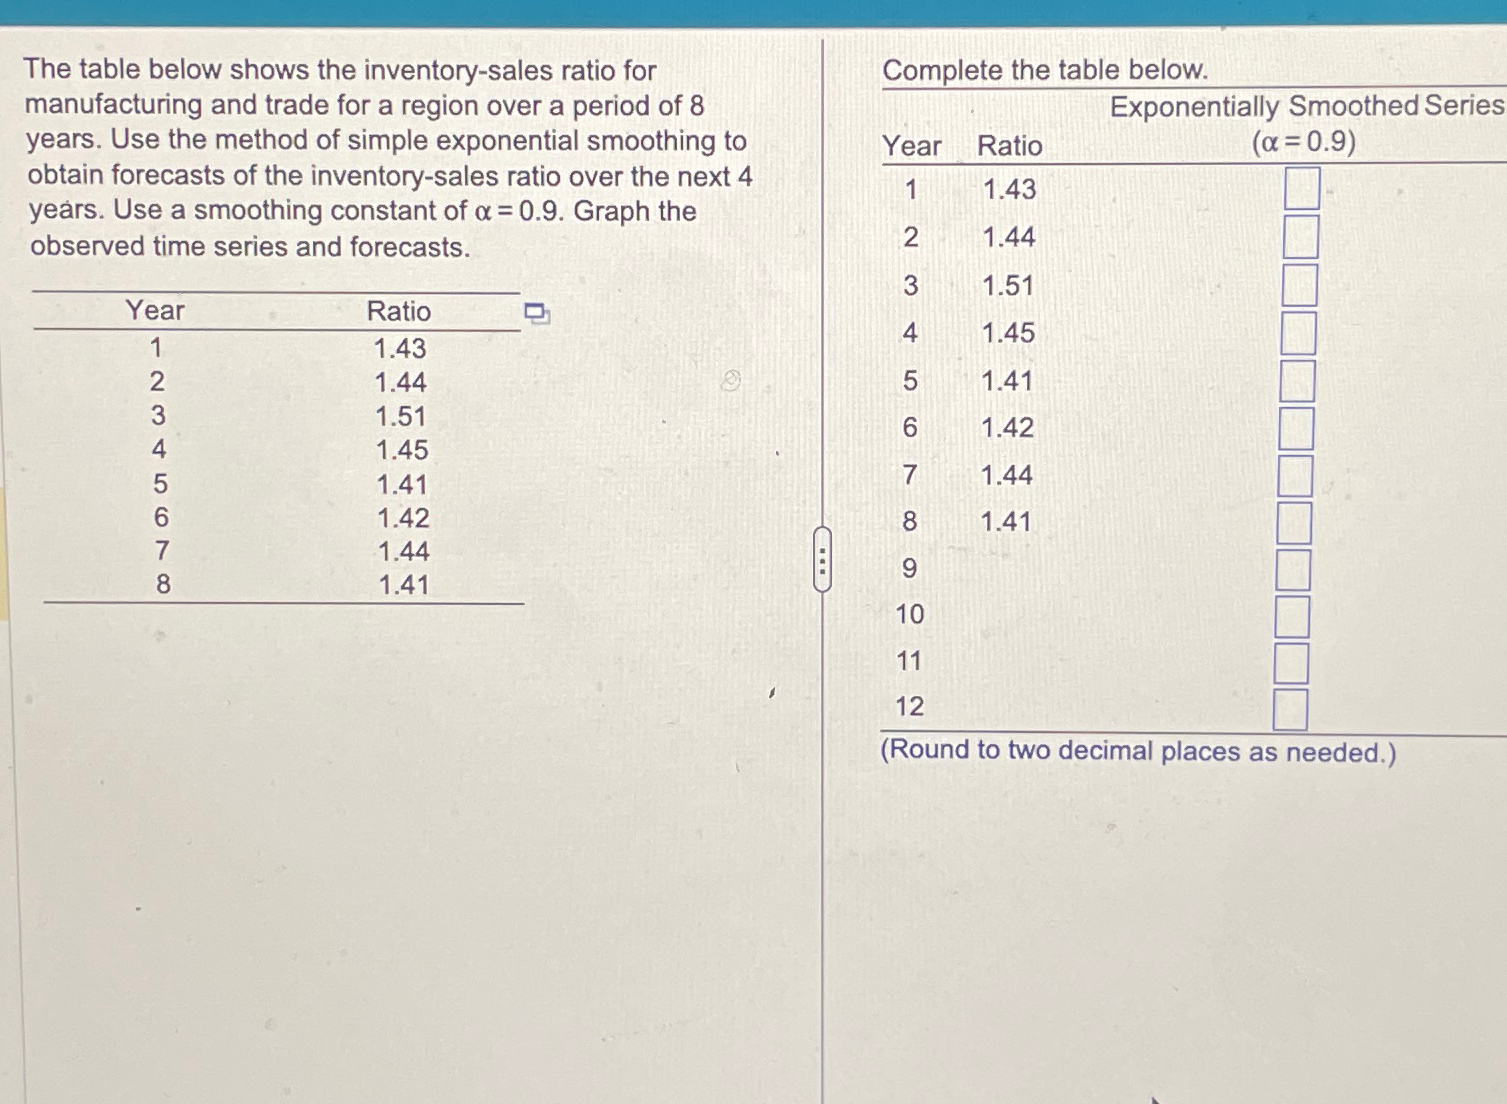
The table below shows the inventorysales ratio for manufacturing and trade for a region over a period of years. Use the method of simple exponential smoothing to obtain forecasts of the inventorysales ratio over the next years. Use a smoothing constant of Graph the observed time series and forecasts.
tableYearRatio
Complete the table below.
tableExponentially Smoothed SeriesYearRatio,
Step by Step Solution
There are 3 Steps involved in it
1 Expert Approved Answer
Step: 1 Unlock

Question Has Been Solved by an Expert!
Get step-by-step solutions from verified subject matter experts
Step: 2 Unlock
Step: 3 Unlock