

Question: The table below shows the one-year sales data for a certain part. a. Compute the one-step-ahead 3-month and 6-month moving-average forecasts for July through December.
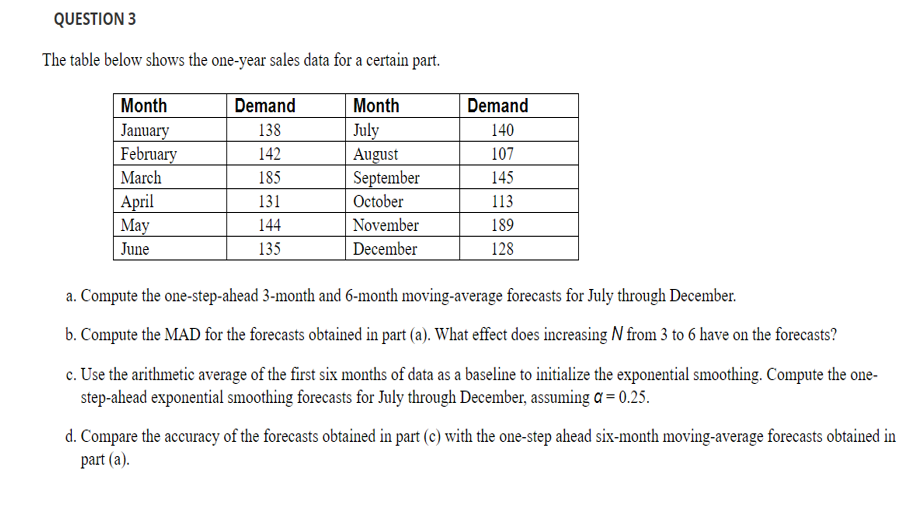
The table below shows the one-year sales data for a certain part. a. Compute the one-step-ahead 3-month and 6-month moving-average forecasts for July through December. b. Compute the MAD for the forecasts obtained in part (a). What effect does increasing N from 3 to 6 have on the forecasts? c. Use the arithmetic average of the first six months of data as a baseline to initialize the exponential smoothing. Compute the onestep-ahead exponential smoothing forecasts for July through December, assuming =0.25. d. Compare the accuracy of the forecasts obtained in part (c) with the one-step ahead six-month moving-average forecasts obtained in part (a)
Step by Step Solution
There are 3 Steps involved in it

Get step-by-step solutions from verified subject matter experts