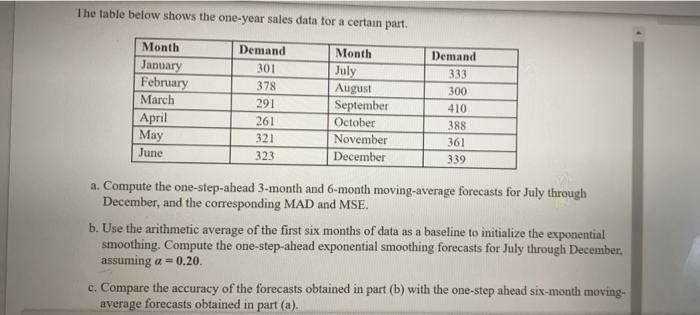
Question: The table below shows the one-year sales data for a certain part. Month January February March April May June Demand 301 378 291 261 321

The table below shows the one-year sales data for
The table below shows the one-year sales data for a certain part. Month January February March April May June Demand 301 378 291 261 321 323 Month July August September October November December Demand 333 300 410 388 361 339 a. Compute the one-step-ahead 3-month and 6-month moving-average forecasts for July through December, and the corresponding MAD and MSE. b. Use the arithmetic average of the first six months of data as a baseline to initialize the exponential smoothing. Compute the one-step-ahead exponential smoothing forecasts for July through December, assuming a = 0.20 c. Compare the accuracy of the forecasts obtained in part (b) with the one-step ahead six-month moving- average forecasts obtained in part (a)

Step by Step Solution

There are 3 Steps involved in it

1 Expert Approved Answer
Step: 1 Unlock blur-text-image
Question Has Been Solved by an Expert!

Get step-by-step solutions from verified subject matter experts

Step: 2 Unlock
Step: 3 Unlock

Students Have Also Explored These Related General Management Questions!