

Question: The table below shows the scores achieved by a group of students on an exam. Using this data, perform a range normalization that generates data
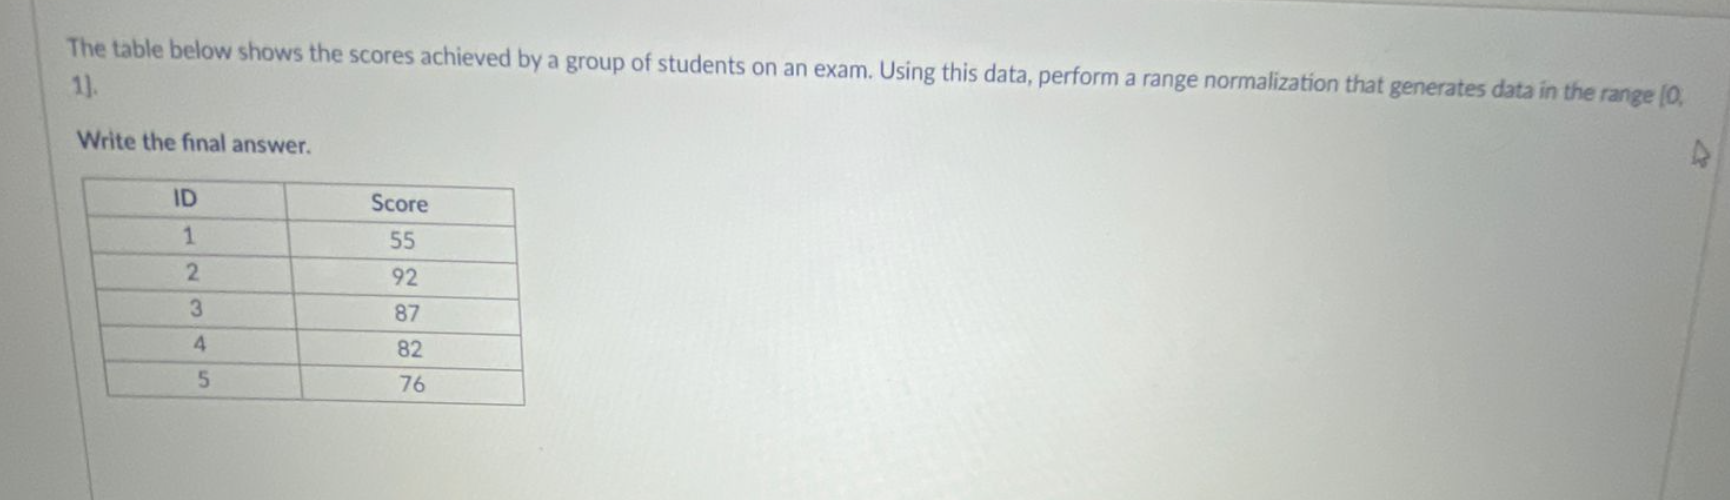
The table below shows the scores achieved by a group of students on an exam. Using this data, perform a range normalization that generates data in the range (0, 1). Write the final answer. ID Score 55 1 2 92 87 3 4. 82 5 76
Step by Step Solution
There are 3 Steps involved in it
1 Expert Approved Answer
Step: 1 Unlock

Question Has Been Solved by an Expert!
Get step-by-step solutions from verified subject matter experts
Step: 2 Unlock
Step: 3 Unlock