

Question: The table below summarizes the trend in Target's inventory data and COGS over the past five years. According to the information, answer the following two
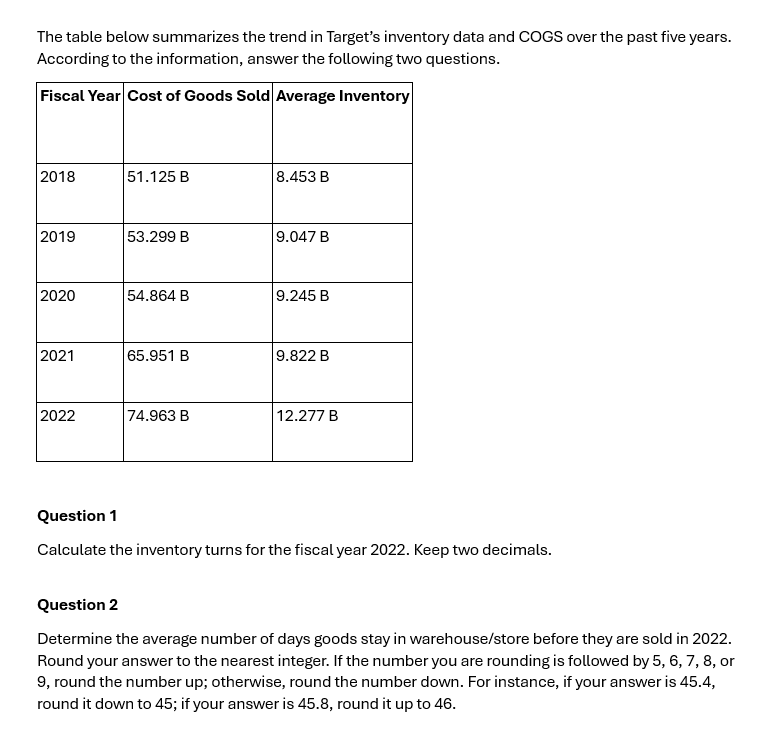
The table below summarizes the trend in Target's inventory data and COGS over the past five years. According to the information, answer the following two questions.
tableFiscal Year,Cost of Goods Sold,Average Inventory B B B B B B B B B B
Question
Calculate the inventory turns for the fiscal year Keep two decimals.
Question
Determine the average number of days goods stay in warehousestore before they are sold in Round your answer to the nearest integer. If the number you are rounding is followed by or round the number up; otherwise, round the number down. For instance, if your answer is round it down to ; if your answer is round it up to
Step by Step Solution
There are 3 Steps involved in it
1 Expert Approved Answer
Step: 1 Unlock

Question Has Been Solved by an Expert!
Get step-by-step solutions from verified subject matter experts
Step: 2 Unlock
Step: 3 Unlock