

Question: The table below (Table 1) provides the experimentally measured cumulative concentration values of five different drugs emitted from a global polymeric particle at certain time
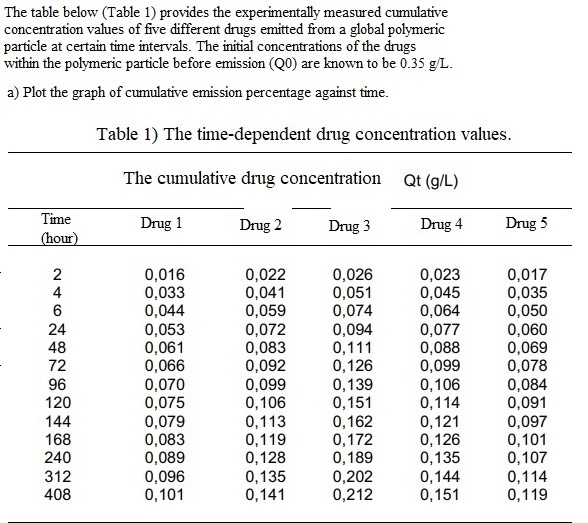
The table below (Table 1) provides the experimentally measured cumulative concentration values of five different drugs emitted from a global polymeric particle at certain time intervals. The initial concentrations of the drugs within the polymeric particle before emission (Q0) are known to be 0.35g/L. a) Plot the graph of cumulative emission percentage against time. Table 1) The time-dependent drug concentration values
Step by Step Solution
There are 3 Steps involved in it
1 Expert Approved Answer
Step: 1 Unlock

Question Has Been Solved by an Expert!
Get step-by-step solutions from verified subject matter experts
Step: 2 Unlock
Step: 3 Unlock