

Question: The table displays the mass M and average fuel consumption op of motor vehicles manufactured by Ford and Honda in 1999. Fit a straight
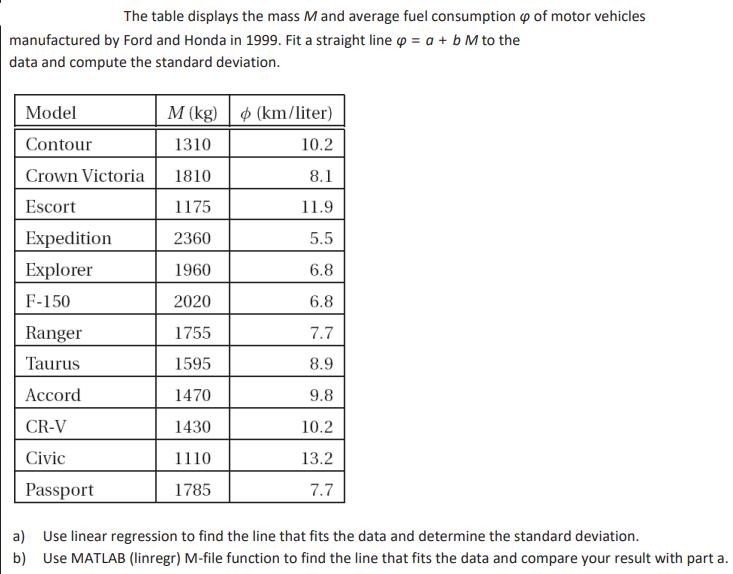
The table displays the mass M and average fuel consumption op of motor vehicles manufactured by Ford and Honda in 1999. Fit a straight line op = a + b M to the data and compute the standard deviation. M (kg) (km/liter) Model Contour 1310 10.2 Crown Victoria 1810 8.1 Escort 1175 11.9 Expedition. 2360 5.5 Explorer 1960 6.8 F-150 2020 6.8 Ranger 1755 7.7 Taurus 1595 8.9 Accord 1470 9.8 CR-V 1430 10.2 Civic 1110 13.2 Passport 1785 7.7 a) Use linear regression to find the line that fits the data and determine the standard deviation. b) Use MATLAB (linregr) M-file function to find the line that fits the data and compare your result with part a.
Step by Step Solution
There are 3 Steps involved in it
Linear regression Linear regression is a statistical method used to predict the value of a dependent ... View full answer

Get step-by-step solutions from verified subject matter experts