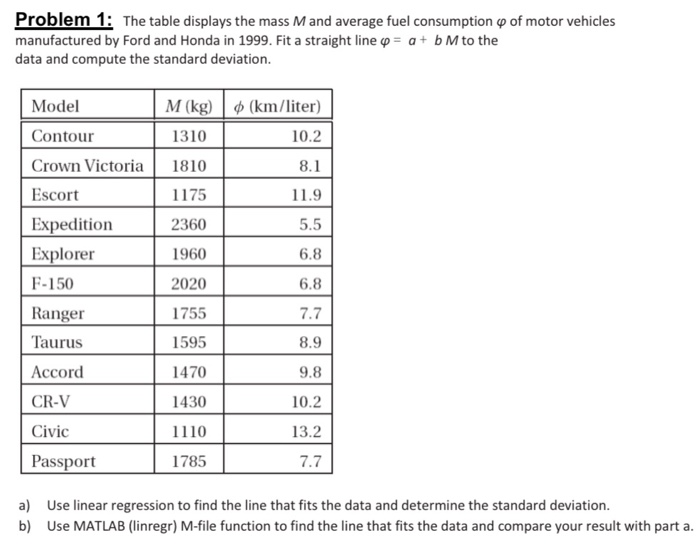
Question: Problem 1: The table displays the mass Mand average fuel consumption of motor vehicles manufactured by Ford and Honda in 1999. Fit a straight line

Problem 1: The table displays the mass Mand
Problem 1: The table displays the mass Mand average fuel consumption of motor vehicles manufactured by Ford and Honda in 1999. Fit a straight line = a + b M to the data and compute the standard deviation. M (kg) (km/liter) 1310 10.2 1810 8.1 1175 11.9 Model Contour Crown Victoria Escort Expedition Explorer F-150 Ranger Taurus 2360 5.5 1960 6.8 2020 6.8 1755 7.7 1595 8.9 Accord 1470 9.8 CR-V 1430 10.2 Civic 1110 13.2 Passport 1785 7.7 a) Use linear regression to find the line that fits the data and determine the standard deviation. b) Use MATLAB (linregr) M-file function to find the line that fits the data and compare your result with part a

Step by Step Solution

There are 3 Steps involved in it

1 Expert Approved Answer
Step: 1 Unlock blur-text-image
Question Has Been Solved by an Expert!

Get step-by-step solutions from verified subject matter experts

Step: 2 Unlock
Step: 3 Unlock

Students Have Also Explored These Related General Management Questions!