

Question: The table given to the right represents the summer power - generating capacity by energy source in a certain county in a recent month. What
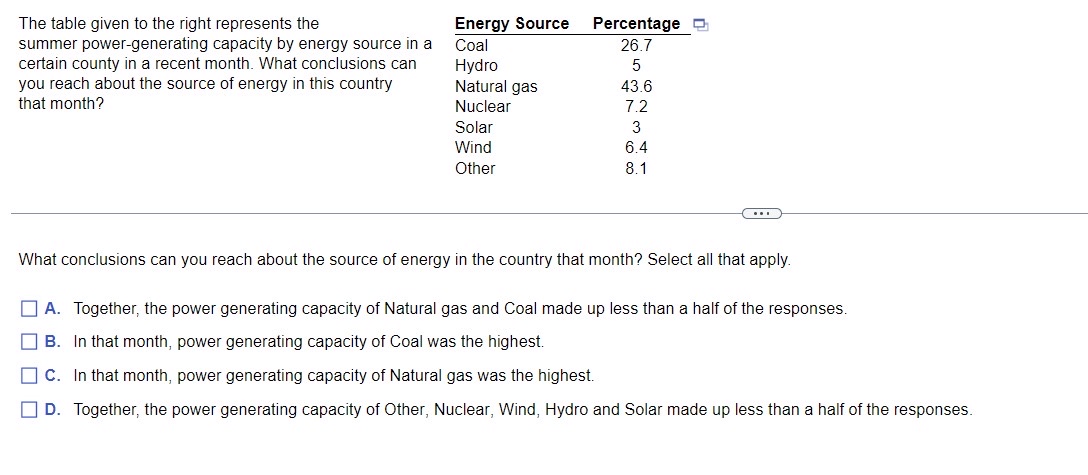
The table given to the right represents the summer powergenerating capacity by energy source in a certain county in a recent month. What conclusions can you reach about the source of energy in this country that month?
tableEnergy Source,PercentageCoalHydroNatural gas,NuclearSolarWindOther
tableEnergy Source,PercentageCoalHydroNatural gas,NuclearSolarWindOther
What conclusions can you reach about the source of energy in the country that month? Select all that apply.
A Together, the power generating capacity of Natural gas and Coal made up less than a half of the responses.
B In that month, power generating capacity of Coal was the highest.
C In that month, power generating capacity of Natural gas was the highest.
D Together, the power generating capacity of Other, Nuclear, Wind, Hydro and Solar made up less than a half of the responses.
Step by Step Solution
There are 3 Steps involved in it
1 Expert Approved Answer
Step: 1 Unlock

Question Has Been Solved by an Expert!
Get step-by-step solutions from verified subject matter experts
Step: 2 Unlock
Step: 3 Unlock