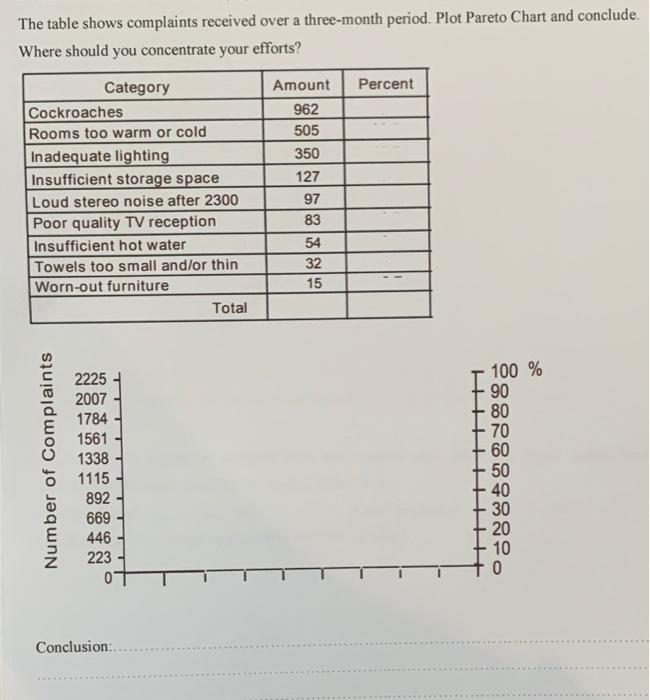
Question: The table shows complaints received over a three-month period. Plot Pareto Chart and conclude. Where should you concentrate your efforts? Amount Percent 962 Category Cockroaches

The table shows complaints received over a
The table shows complaints received over a three-month period. Plot Pareto Chart and conclude. Where should you concentrate your efforts? Amount Percent 962 Category Cockroaches Rooms too warm or cold Inadequate lighting Insufficient storage space Loud stereo noise after 2300 Poor quality TV reception Insufficient hot water Towels too small and/or thin Worn-out furniture Total 505 350 127 97 83 54 32 15 Number of Complaints 2225 2007 1784 1561 1338 1115 892 669 446 223 09 100 % 90 80 70 60 . 50 40 30 20 10 0 Conclusion

Step by Step Solution

There are 3 Steps involved in it

1 Expert Approved Answer
Step: 1 Unlock blur-text-image
Question Has Been Solved by an Expert!

Get step-by-step solutions from verified subject matter experts

Step: 2 Unlock
Step: 3 Unlock

Students Have Also Explored These Related General Management Questions!