

Question: The table shows data collected on the relationship between age in years and daily time spent on the phone The line of best fit for

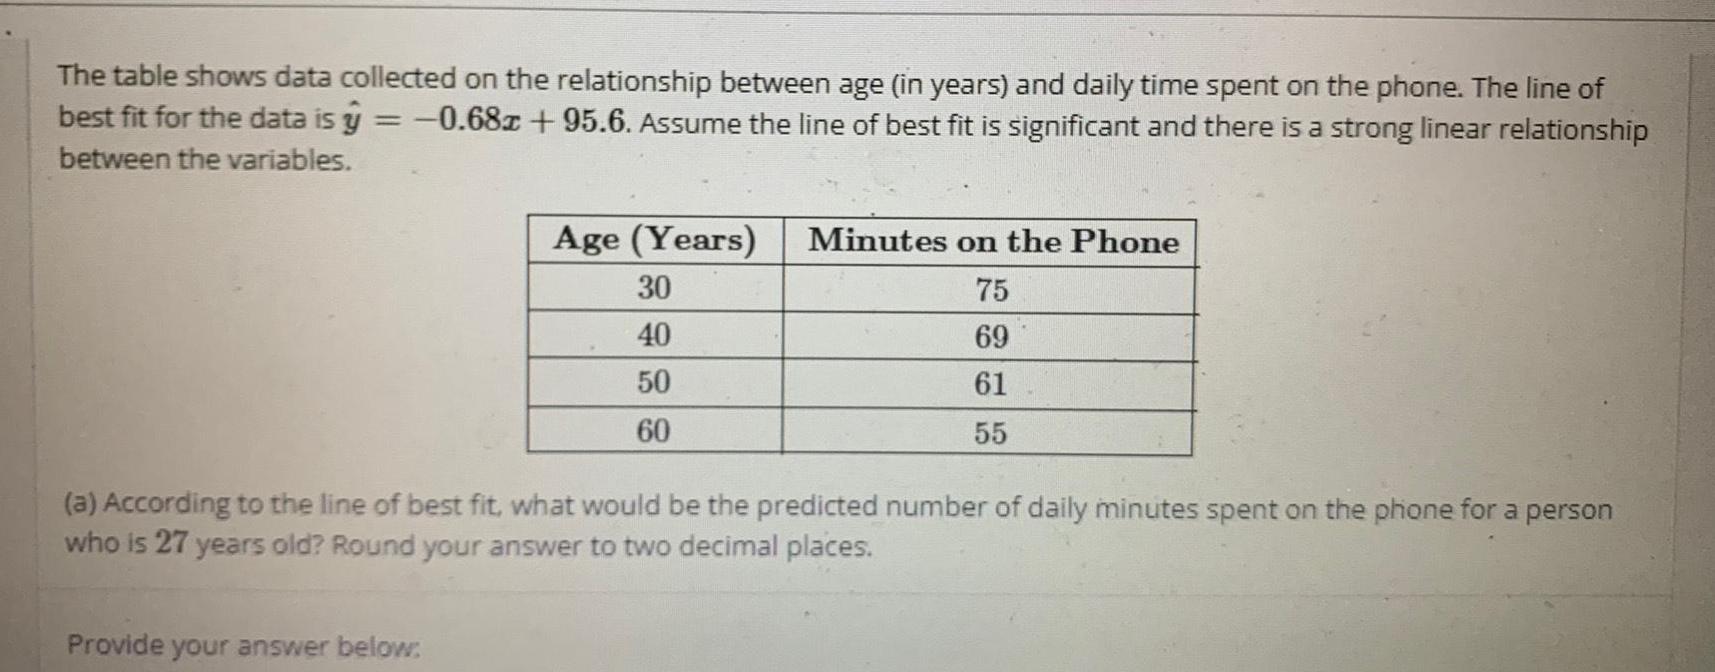
The table shows data collected on the relationship between age in years and daily time spent on the phone The line of best fit for the data is y 0 68z 95 6 Assume the line of best fit is significant and there is a strong linear relationship between the variables Age Years 30 40 50 60 Provide your answer below Minutes on the Phone 75 69 61 55 a According to the line of best fit what would be the predicted number of daily minutes spent on the phone for a person who is 27 years old Round your answer to two decimal places
Step by Step Solution
There are 3 Steps involved in it
1 Expert Approved Answer
Step: 1 Unlock

Question Has Been Solved by an Expert!
Get step-by-step solutions from verified subject matter experts
Step: 2 Unlock
Step: 3 Unlock