

Question: The table shows data collected on the relationship between the average daily temperature and time spent watching television. The line of best fit for the
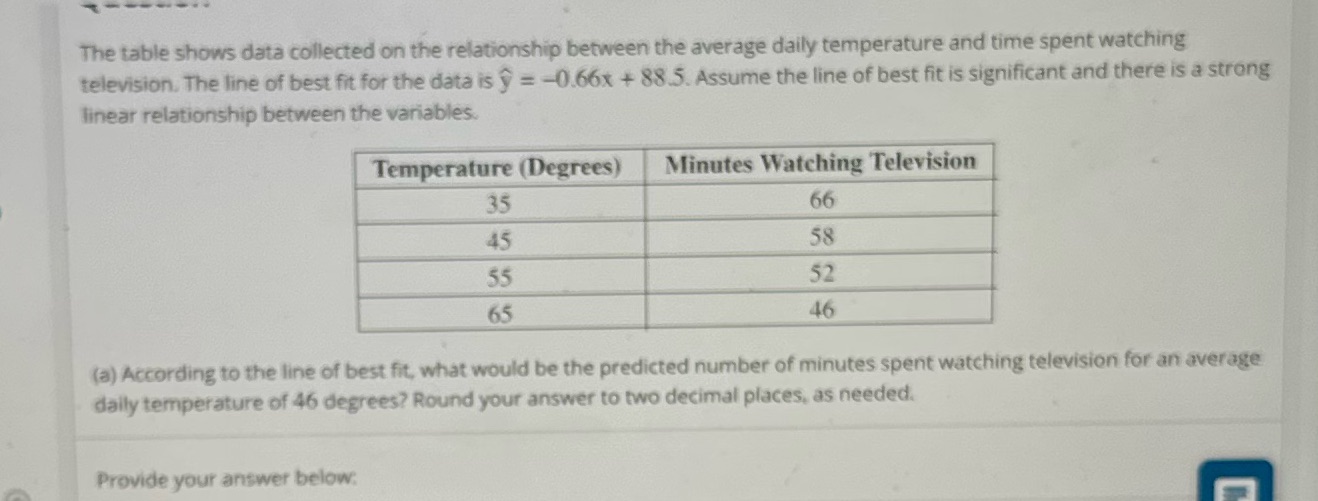
The table shows data collected on the relationship between the average daily temperature and time spent watching television. The line of best fit for the data is y = -0.66x + 88.5. Assume the line of best fit is significant and there is a strong linear relationship between the variables. Temperature (Degrees) Minutes Watching Television 35 66 45 58 55 52 65 46 (a) According to the line of best fit, what would be the predicted number of minutes spent watching television for an average daily temperature of 46 degrees? Round your answer to two decimal places, as needed. Provide your answer below
Step by Step Solution
There are 3 Steps involved in it
1 Expert Approved Answer
Step: 1 Unlock

Question Has Been Solved by an Expert!
Get step-by-step solutions from verified subject matter experts
Step: 2 Unlock
Step: 3 Unlock