

Question: The table shows data collected on the relationship between the average number of minutes spent exercising per day and math test scores. The line
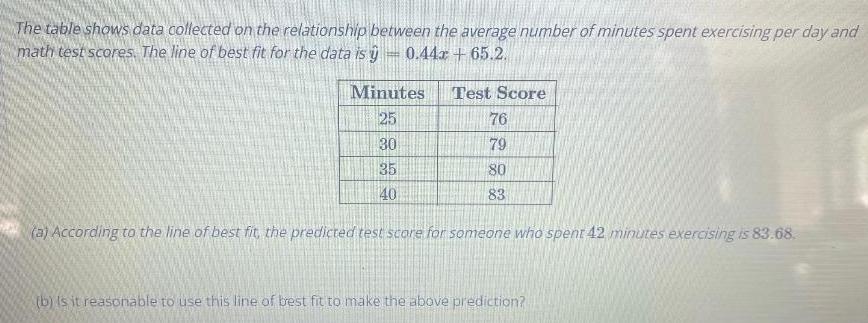
The table shows data collected on the relationship between the average number of minutes spent exercising per day and math test scores. The line of best fit for the data is y 0.44x+65.2. S Minutes 25 30 35 40 Test Score 76 79 80 83 (a) According to the line of best fit, the predicted test score for someone who spent 42 minutes exercising is 83.68. (b) Is it reasonable to use this line of best fit to make the above prediction?
Step by Step Solution
3.41 Rating (151 Votes )
There are 3 Steps involved in it
Since For y 11 044m 652 n y y 42 Yes it is resonable best fit Because ... View full answer

Get step-by-step solutions from verified subject matter experts