

Question: The table shows the prices (in dollars) for a sample of automobile batteries. The prices are classified according to battery type. At = 0.05, is
The table shows the prices (in dollars) for a sample of automobile batteries. The prices are classified according to battery type. At = 0.05, is there enough evidence to conclude that at least one mean battery price is different from the others? Assume the samples are random and independent, the populations are normally distributed, and the population variances are equal.
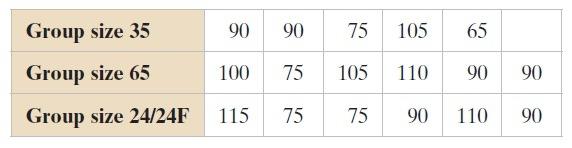
\begin{tabular}{|l|r|r|r|r|r|r|} \hline Group size 35 & 90 & 90 & 75 & 105 & 65 & \\ \hline Group size 65 & 100 & 75 & 105 & 110 & 90 & 90 \\ \hline Group size 24/24F & 115 & 75 & 75 & 90 & 110 & 90 \\ \hline \end{tabular}
Step by Step Solution
There are 3 Steps involved in it
1 Expert Approved Answer
Step: 1 Unlock

Question Has Been Solved by an Expert!
Get step-by-step solutions from verified subject matter experts
Step: 2 Unlock
Step: 3 Unlock