

Question: The table shows the prices (in dollars) for a sample of automobile batteries. The prices are classified according to battery type. At = 0.05,
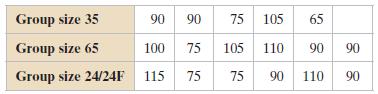
The table shows the prices (in dollars) for a sample of automobile batteries. The prices are classified according to battery type. At α = 0.05, is there enough evidence to conclude that at least one mean battery price is different from the others?
(a) Identify the claim and state H0 and Ha,
(b) Find the critical value and identify the rejection region,
(c) Find the test statistic F,
(d) Decide whether to reject or fail to reject the null hypothesis,
(e) Interpret the decision in the context of the original claim. Assume the samples are random and independent, the populations are normally distributed, and the population variances are equal. If convenient, use technology.
Group size 35 Group size 65 100 75 105 110 90 90 Group size 24/24F 115 7575 90 110 90 90 9075 105 65
Step by Step Solution
3.33 Rating (156 Votes )
There are 3 Steps involved in it
a The claim is that at least one mean battery price ... View full answer

Get step-by-step solutions from verified subject matter experts
Document Format (1 attachment)
598-M-S-C-S-T (900).docx
120 KBs Word File