

Question: The table that showing down is data about weather conditions based on the given data we can guess if the weather good to play or
The table that showing down is data about weather conditions based on the given data we can guess if the weather good to play or not
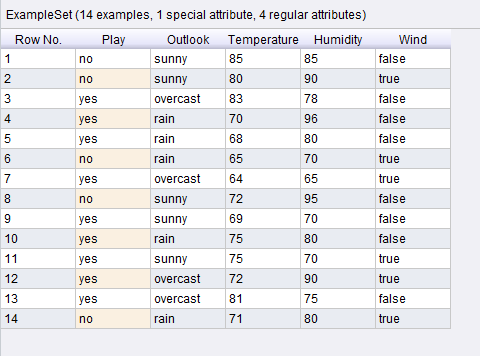
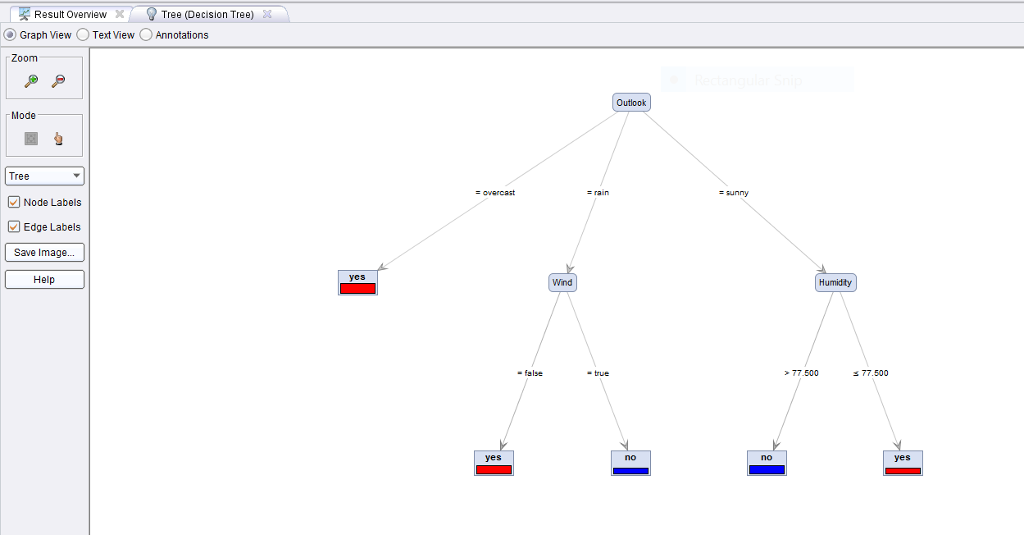
By using RapidMiner software with operator of decision tree on table of golf weather that showing up
Need to analyze decision tree that shown down for each trace arrow:
Example Set (14 examples, 1 special attribute, 4 regular attributes Row No Pla Outlook Temperature Humidity Wind 1 no Sunny 85 85 false 80 90 true no Sunny 3 yes overcast 83 78 false 70 96 false yes rain 5 yes rain 68 80 false 65 70 true no rain 7 yes overcast 64 65 true 72 95 false no Sunny 9 yes Sunny 69 70 false 10 75 800 false yes rain 11 yes Sunny 75 70 true overcast 72 12 90 true yes 13 overcast 81 75 false yes 14 no rain 71 80 true
Step by Step Solution
There are 3 Steps involved in it

Get step-by-step solutions from verified subject matter experts