

Question: The table to the right contains observed values and expected vallies in pevenifieses for two categorical variables, X and Y where variable X has three
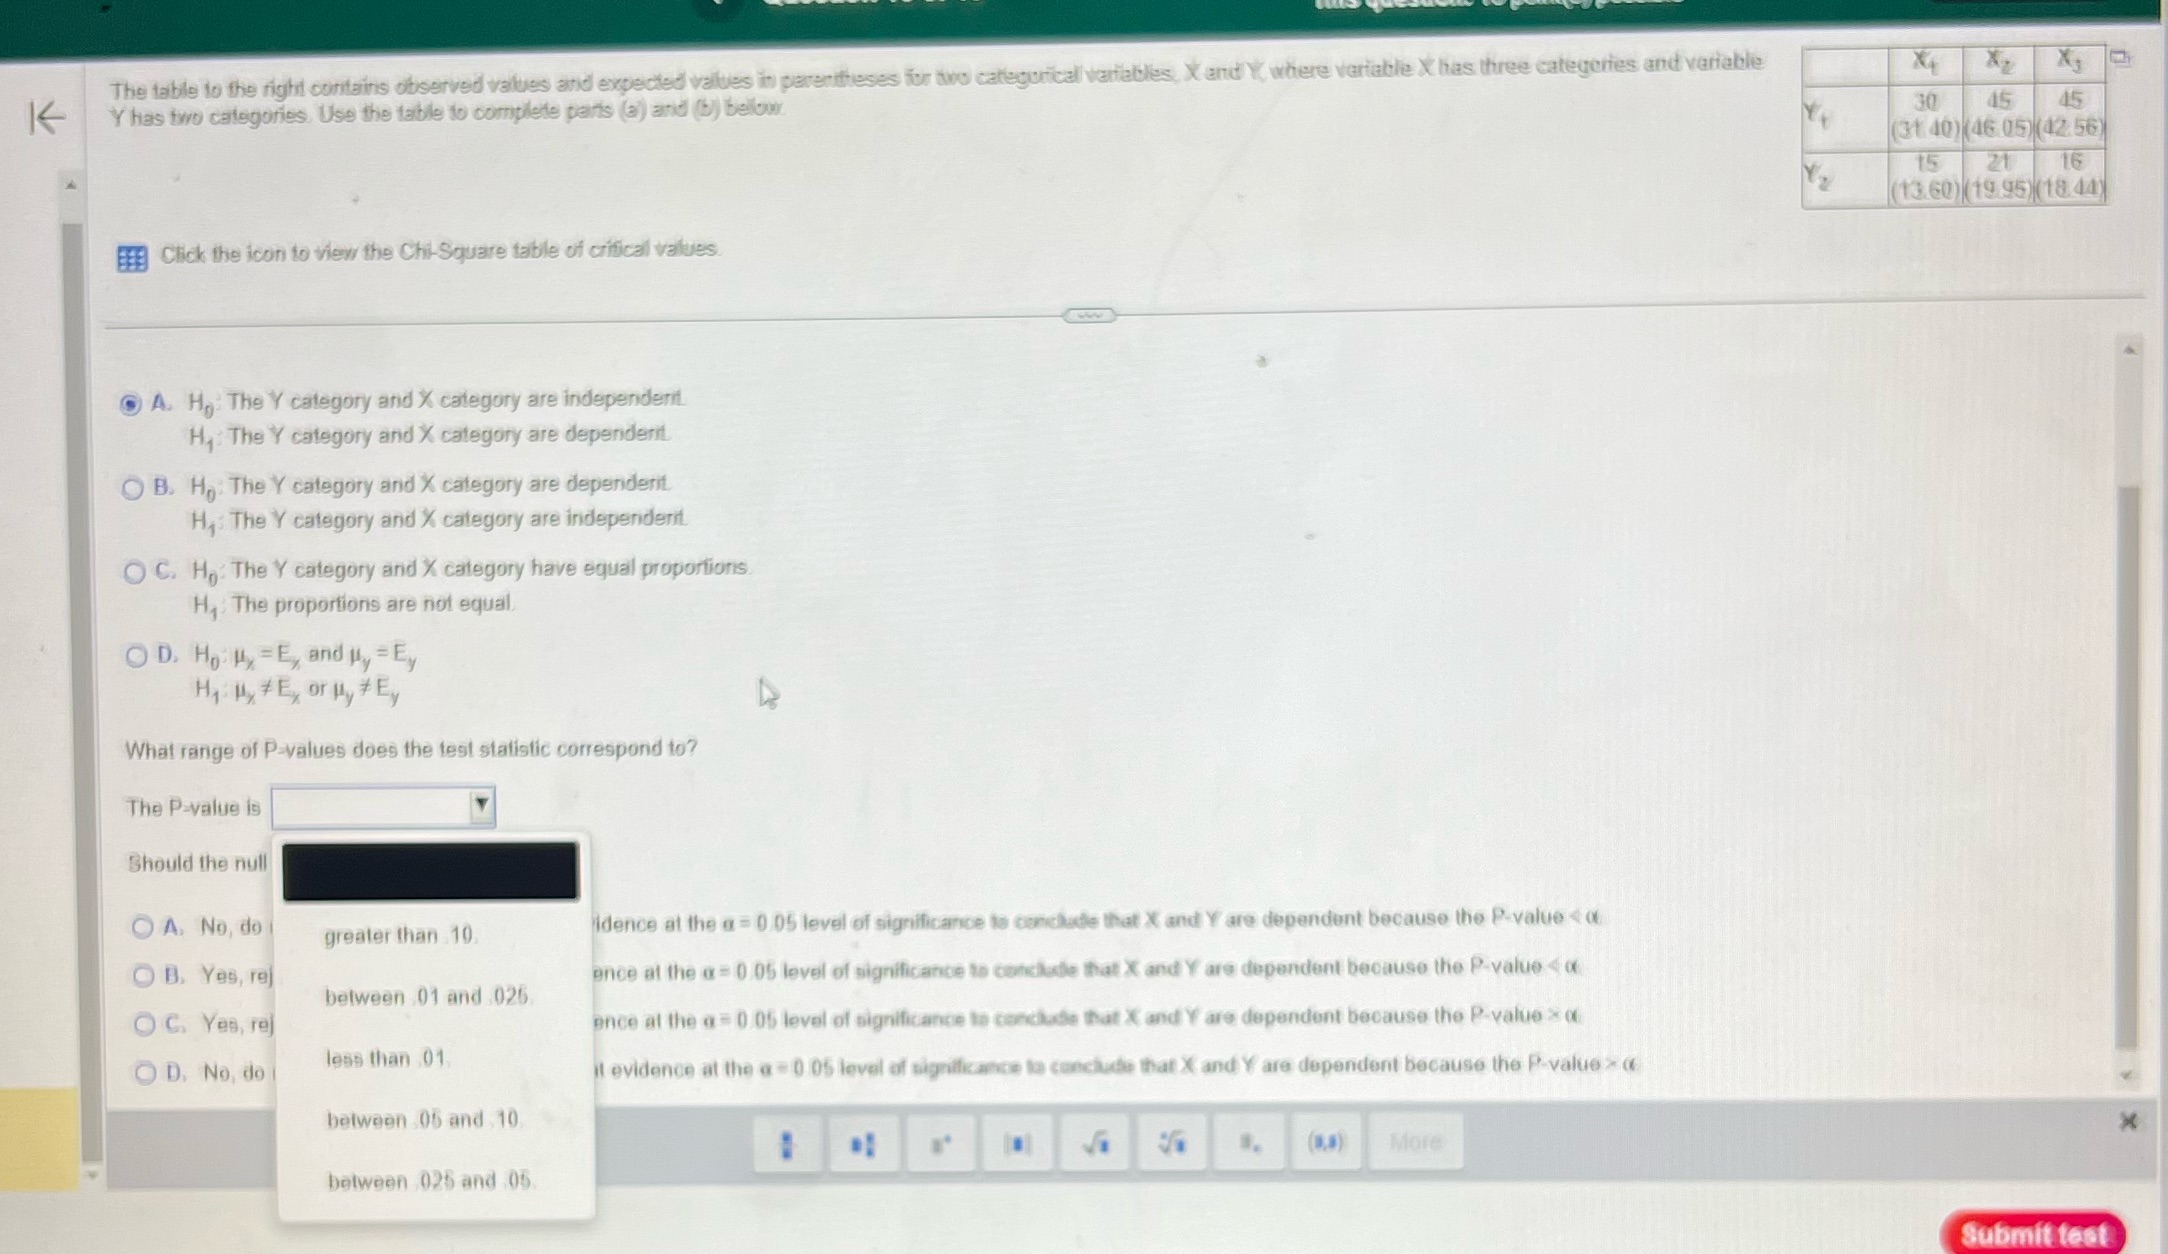
The table to the right contains observed values and expected vallies in pevenifieses for two categorical variables, X and Y where variable X has three categories and variable X4 K Y has two categories, Use the table to complete paris (@) and (b) below. 30 45 45 31 40) 46 05)(42 56) 15 21 16 13.60) (19 95)(18.44) FFF Click the icon to view the Chi-Square table of critical values A. He: The Y category and X category are independent Hy: The Y category and X category are dependent O B. He: The Y category and X category are dependent. Hy: The Y category and X category are independent C. He: The Y category and X category have equal proportions. H,: The proportions are not equal O D. Ho My = E, and My = Ey Hy My * E, or My # Ey What range of P-values does the test statistic correspond to? The P-value is Should the null A. No, do greater than 10 idence at the a = 0/05 level of significance to conclude that X and Y are dependent because the P-value of D. No, do less than 01 it evidence at the a # 0 05 level of significance to conclude that X and Y are dependent because the P-value > a between 05 and 10 More between 025 and 05 Submit test
Step by Step Solution
There are 3 Steps involved in it

Get step-by-step solutions from verified subject matter experts