

Question: The task is based on Inventory Models. It will provide you with demands for some periods. It will ask you to use an appropriate inventory
The task is based on Inventory Models. It will provide you with demands for some periods. It will ask you to use an appropriate inventory method to manage the demand. This may require some approximation/adjustment, etc. You need to describe how the policy will be implemented, what adjustment will you make, the impact of the adjustment, and your comments/recommendations based on the implementation. Please complete the task found within the excel sheet ( Task 1) and 2) found in the picture ).
From this data, please do the following to answer the question. These are the instructions:
And here is a sample of what it should look like to help guide you.
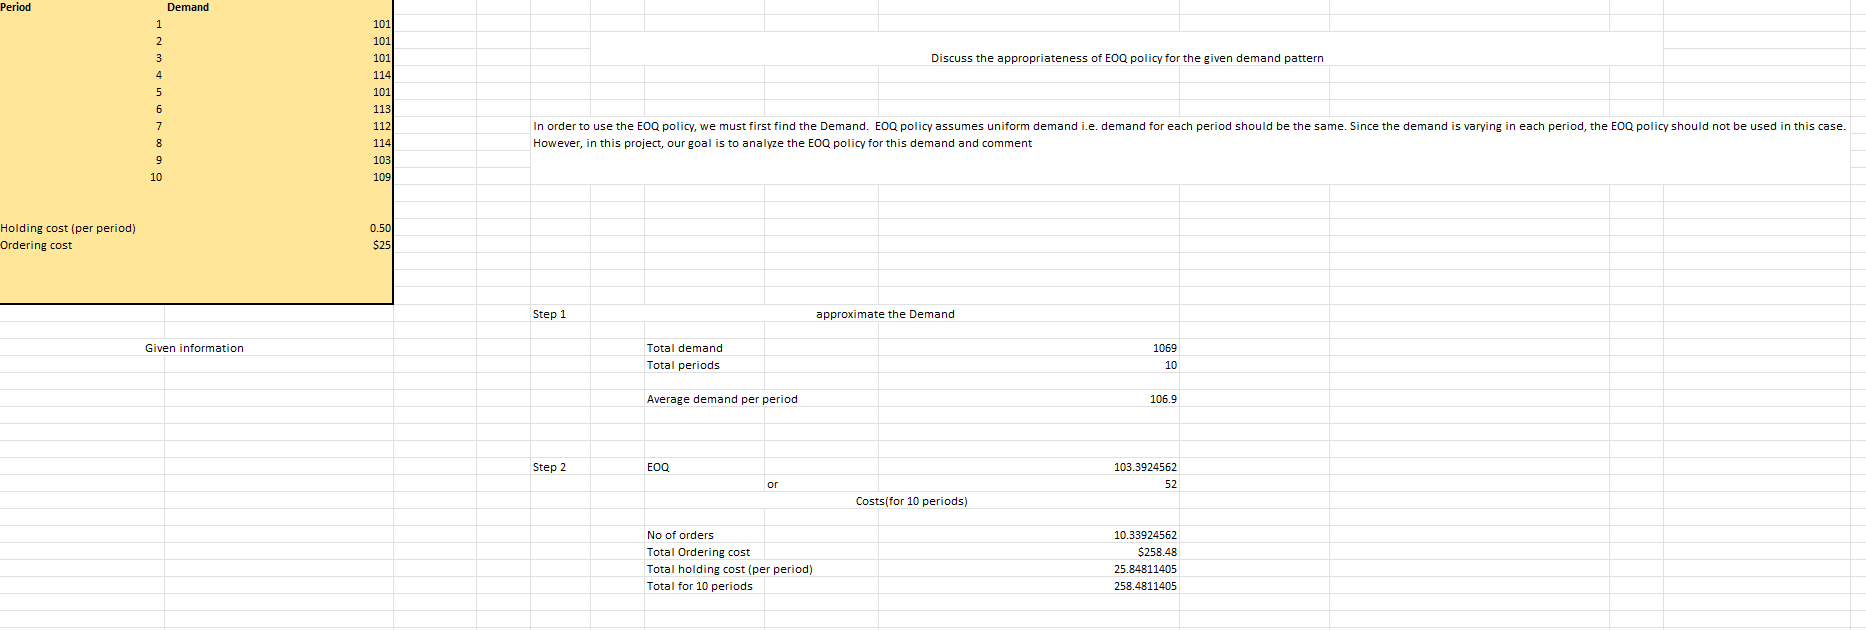
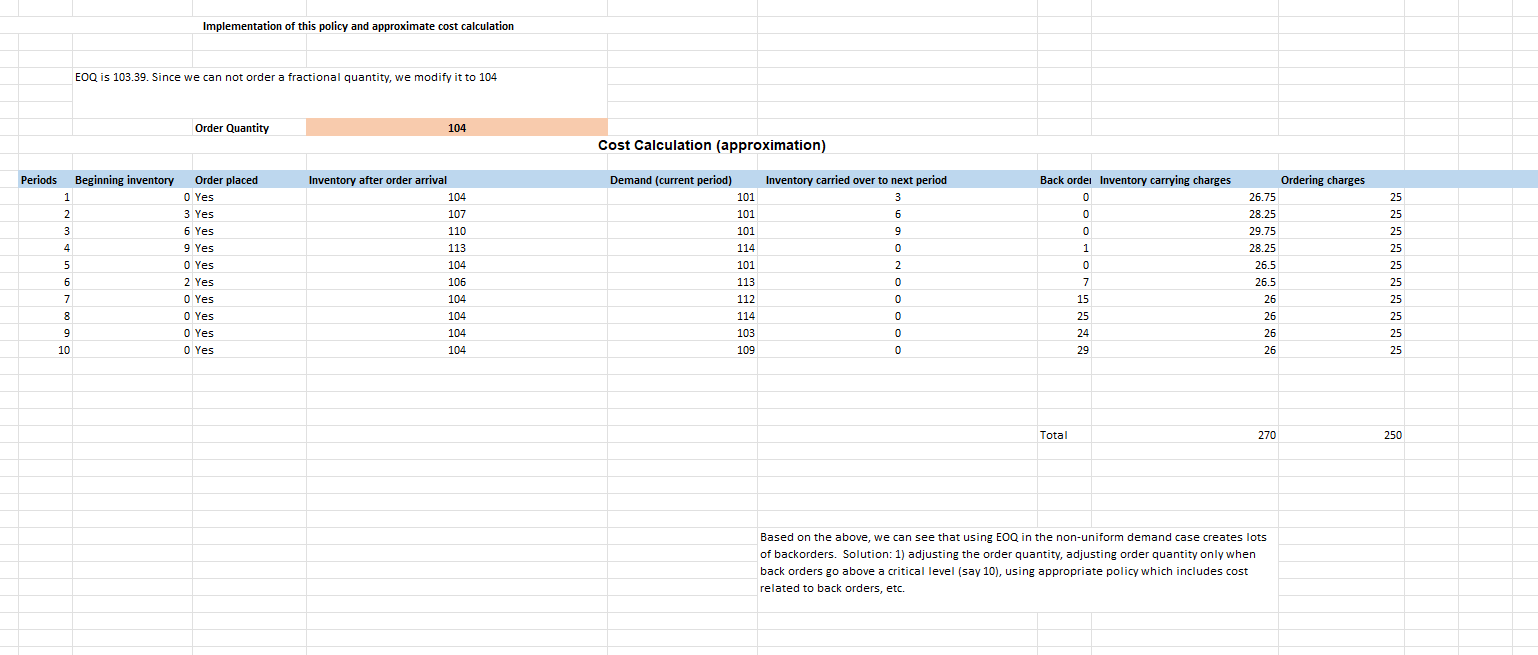
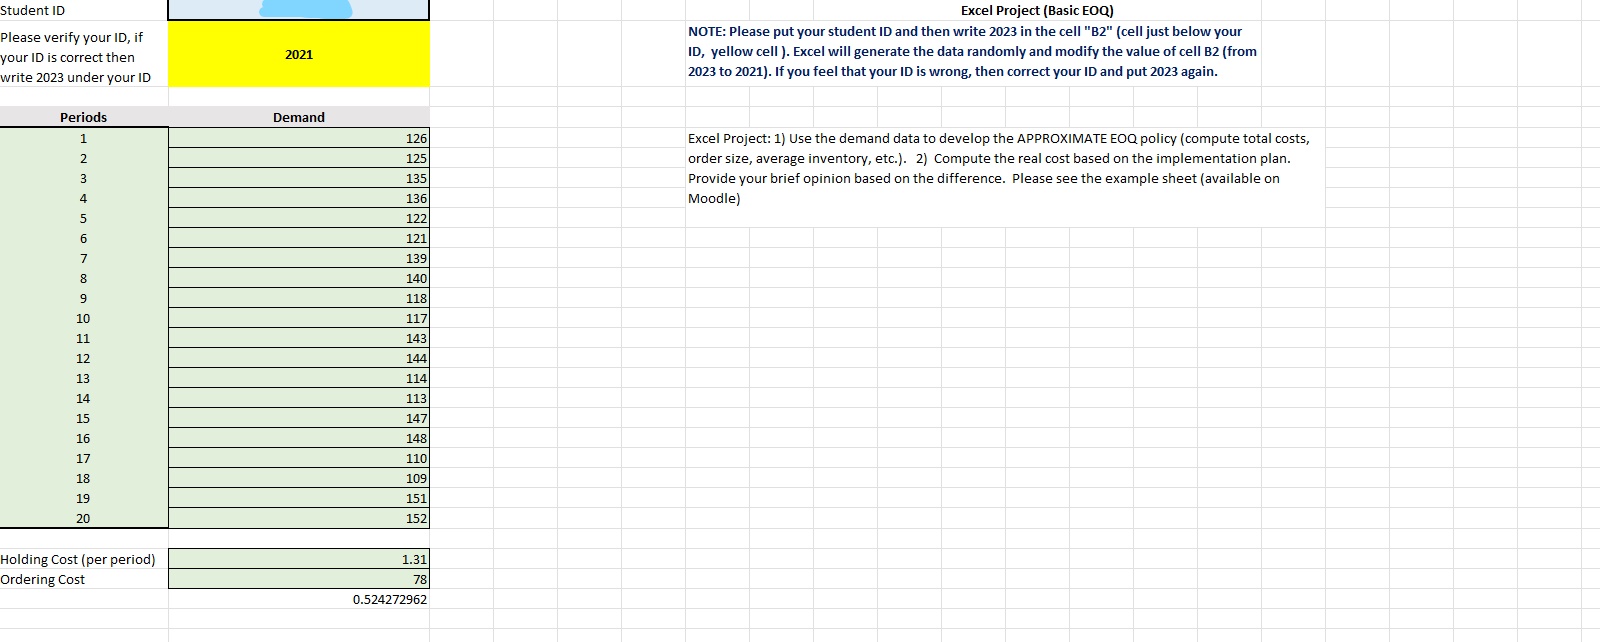
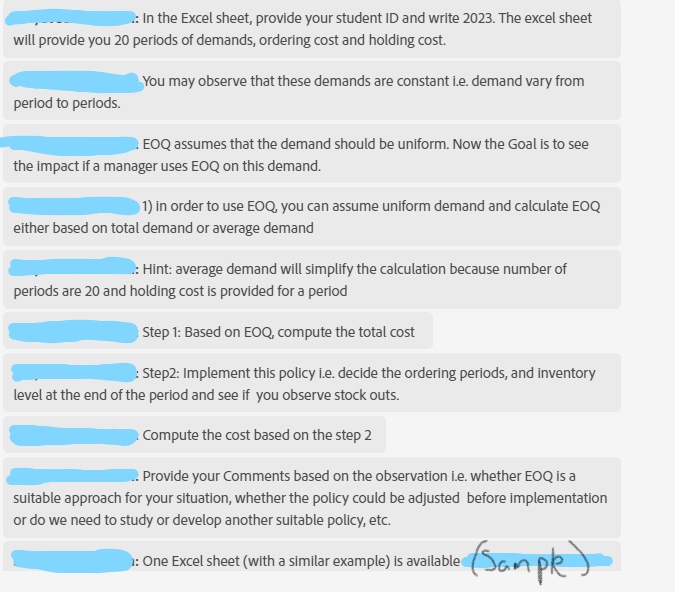
Excel Project (Basic EOQ) NOTE: Please put your student ID and then write 2023 in the cell "B2" (cell just below your ID, yellow cell ). Excel will generate the data randomly and modify the value of cell B2 (from 2023 to 2021). If you feel that your ID is wrong, then correct your ID and put 2023 again. Excel Project: 1) Use the demand data to develop the APPROXIMATE EOQ policy (compute total costs, order size, average inventory, etc.). 2) Compute the real cost based on the implementation plan. Provide your brief opinion based on the difference. Please see the example sheet (available on Moodle) : In the Excel sheet, provide your student ID and write 2023. The excel sheet will provide you 20 periods of demands, ordering cost and holding cost. You may observe that these demands are constant i.e. demand vary from period to periods. EOQ assumes that the demand should be uniform. Now the Goal is to see the impact if a manager uses EOQ on this demand. 1) in order to use EOQ, you can assume uniform demand and calculate EOQ either based on total demand or average demand : Hint: average demand will simplify the calculation because number of periods are 20 and holding cost is provided for a period : Step2: Implement this policy i.e. decide the ordering periods, and inventory level at the end of the period and see if you observe stock outs. Provide your Comments based on the observation i.e. whether EOQ is a suitable approach for your situation, whether the policy could be adjusted before implementation or do we need to study or develop another suitable policy, etc. Implementation of this policy and approximate cost calculation EOQ is 103.39. Since we can not order a fractional quantity, we modify it to 104 Order Quantity 104 Cost Calculation (approximation) \begin{tabular}{|r|l|l|} \hline Periods & Beginning inventory & Order placed \\ \hline 1 & 0 Yes \\ \hline 2 & 3 Yes \\ \hline 3 & 6 Yes \\ \hline 4 & 9 Yes \\ \hline 5 & 0 Yes \\ \hline 6 & 2 Yes \\ \hline 7 & 0 Yes \\ \hline 8 & 0 Yes \\ \hline 9 & 0 Yes \\ \hline 10 & 0 Yes \\ \hline \end{tabular} Inventory after order arrival 104 107 110 11 104 10 104 104 104 104 \begin{tabular}{|r|c|} \hline Demand (current period) & Inventory carried over to next period \\ \hline 101 & 3 \\ \hline 101 & 6 \\ \hline 101 & 9 \\ \hline 114 & 0 \\ \hline 101 & 2 \\ \hline 113 & 0 \\ \hline 112 & 0 \\ \hline 114 & 0 \\ \hline 103 & 0 \\ \hline 109 & 0 \\ \hline \end{tabular} Based on the above, we can see that using EOQ in the non-uniform demand case creates lots of backorders. Solution: 1) adjusting the order quantity, adjusting order quantity only when back orders go above a critical level (say 10), using appropriate policy which includes cost related to back orders, etc. Excel Project (Basic EOQ) NOTE: Please put your student ID and then write 2023 in the cell "B2" (cell just below your ID, yellow cell ). Excel will generate the data randomly and modify the value of cell B2 (from 2023 to 2021). If you feel that your ID is wrong, then correct your ID and put 2023 again. Excel Project: 1) Use the demand data to develop the APPROXIMATE EOQ policy (compute total costs, order size, average inventory, etc.). 2) Compute the real cost based on the implementation plan. Provide your brief opinion based on the difference. Please see the example sheet (available on Moodle) : In the Excel sheet, provide your student ID and write 2023. The excel sheet will provide you 20 periods of demands, ordering cost and holding cost. You may observe that these demands are constant i.e. demand vary from period to periods. EOQ assumes that the demand should be uniform. Now the Goal is to see the impact if a manager uses EOQ on this demand. 1) in order to use EOQ, you can assume uniform demand and calculate EOQ either based on total demand or average demand : Hint: average demand will simplify the calculation because number of periods are 20 and holding cost is provided for a period : Step2: Implement this policy i.e. decide the ordering periods, and inventory level at the end of the period and see if you observe stock outs. Provide your Comments based on the observation i.e. whether EOQ is a suitable approach for your situation, whether the policy could be adjusted before implementation or do we need to study or develop another suitable policy, etc. Implementation of this policy and approximate cost calculation EOQ is 103.39. Since we can not order a fractional quantity, we modify it to 104 Order Quantity 104 Cost Calculation (approximation) \begin{tabular}{|r|l|l|} \hline Periods & Beginning inventory & Order placed \\ \hline 1 & 0 Yes \\ \hline 2 & 3 Yes \\ \hline 3 & 6 Yes \\ \hline 4 & 9 Yes \\ \hline 5 & 0 Yes \\ \hline 6 & 2 Yes \\ \hline 7 & 0 Yes \\ \hline 8 & 0 Yes \\ \hline 9 & 0 Yes \\ \hline 10 & 0 Yes \\ \hline \end{tabular} Inventory after order arrival 104 107 110 11 104 10 104 104 104 104 \begin{tabular}{|r|c|} \hline Demand (current period) & Inventory carried over to next period \\ \hline 101 & 3 \\ \hline 101 & 6 \\ \hline 101 & 9 \\ \hline 114 & 0 \\ \hline 101 & 2 \\ \hline 113 & 0 \\ \hline 112 & 0 \\ \hline 114 & 0 \\ \hline 103 & 0 \\ \hline 109 & 0 \\ \hline \end{tabular} Based on the above, we can see that using EOQ in the non-uniform demand case creates lots of backorders. Solution: 1) adjusting the order quantity, adjusting order quantity only when back orders go above a critical level (say 10), using appropriate policy which includes cost related to back orders, etc
Step by Step Solution
There are 3 Steps involved in it

Get step-by-step solutions from verified subject matter experts