

Question: The tasks should be performed using SPSS software Informations needed for the tasks Tasks to be done Please give details comments for task 6. Task
The tasks should be performed using SPSS software Informations needed for the tasks
Tasks to be done
Please give details comments for task 6.
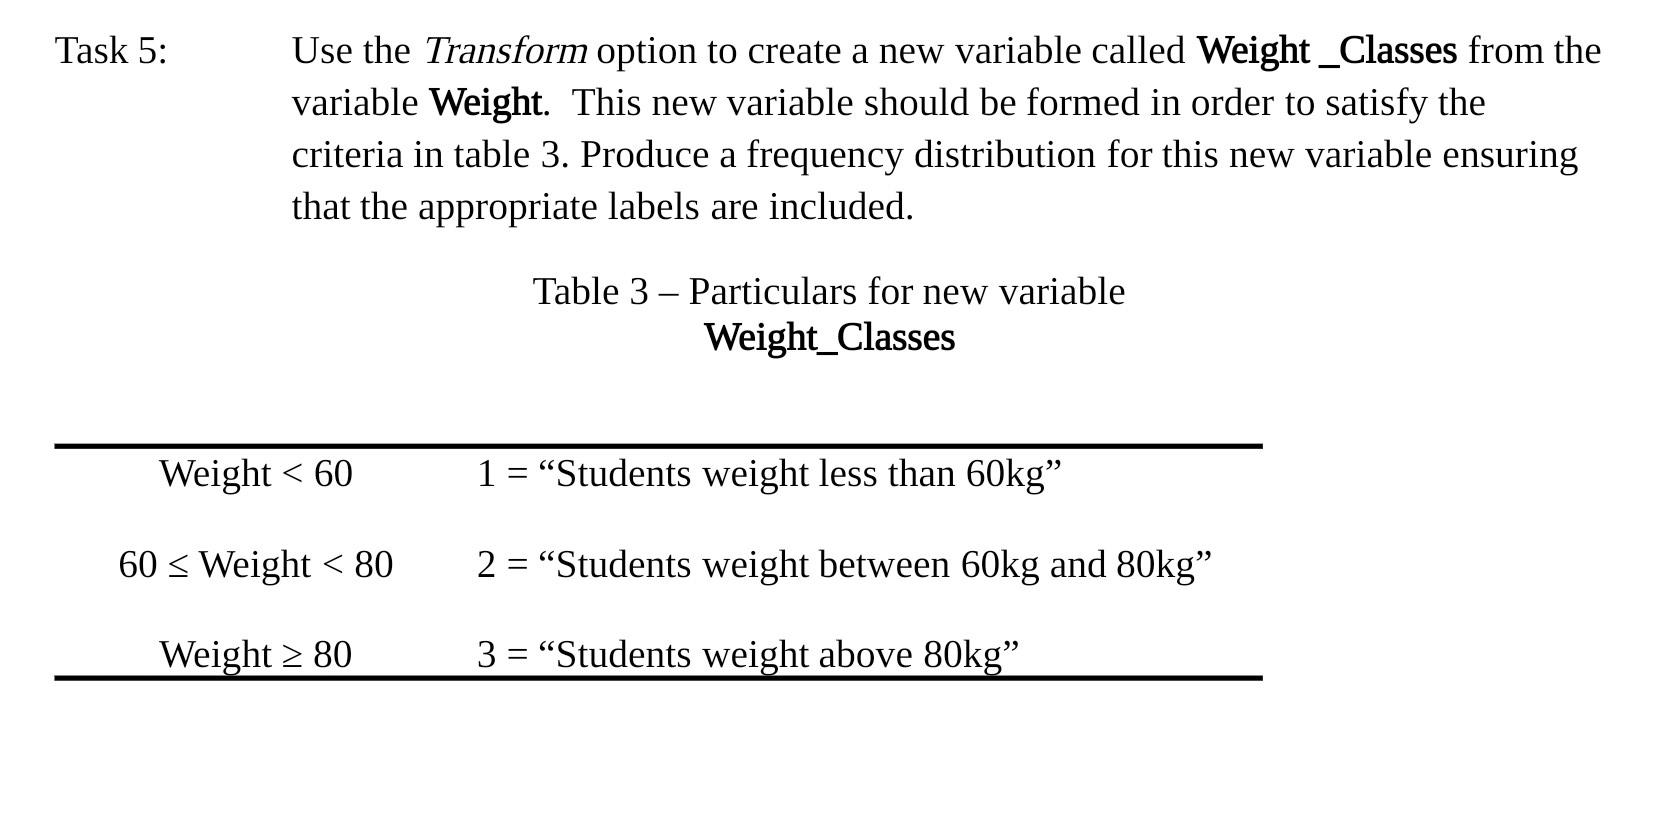
Task 5 Grouped frequency distribution with appropriate labels (Weight _Classes)
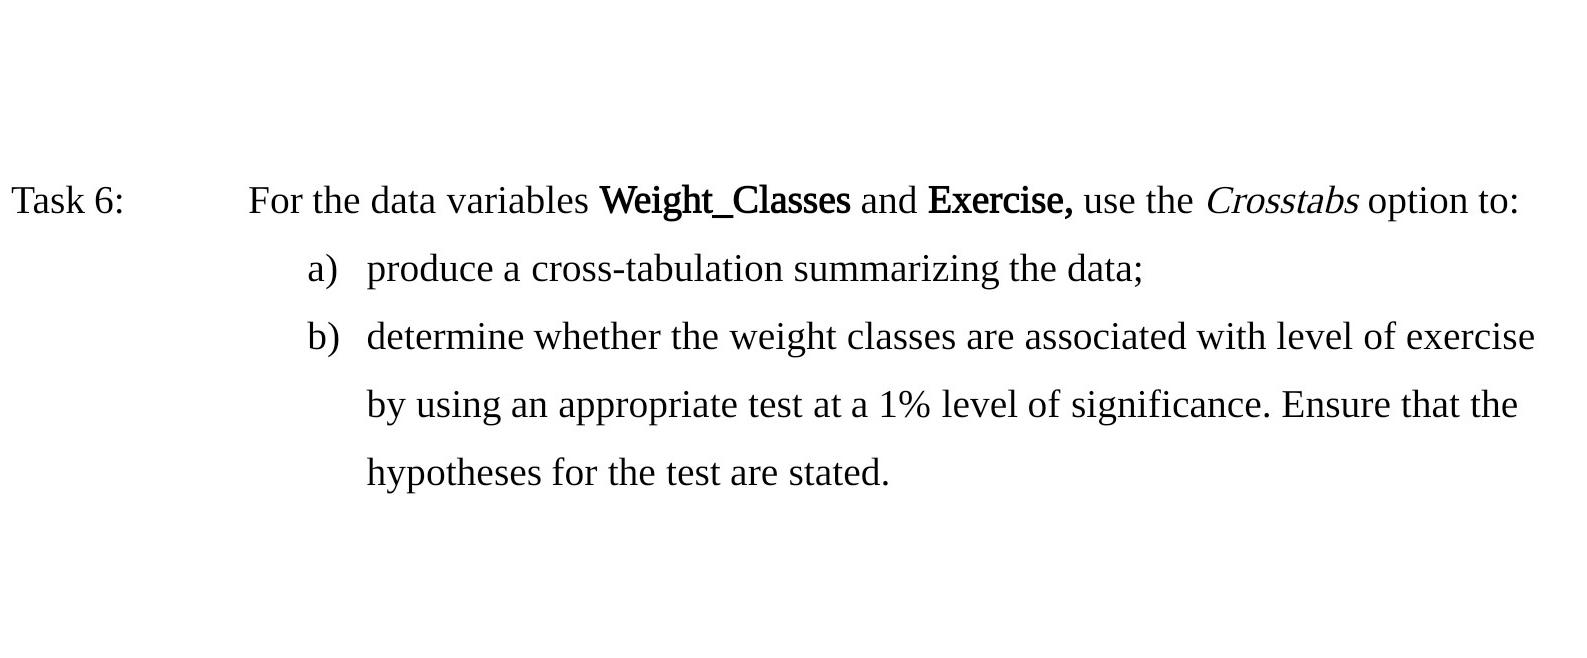
Task 6 Cross-tabulation (Weight_Class and Exercise)
Correct hypotheses stated for the test conducted
Appropriate significance test conducted
Output showing results of test conducted
Correct conclusion stated for significance test
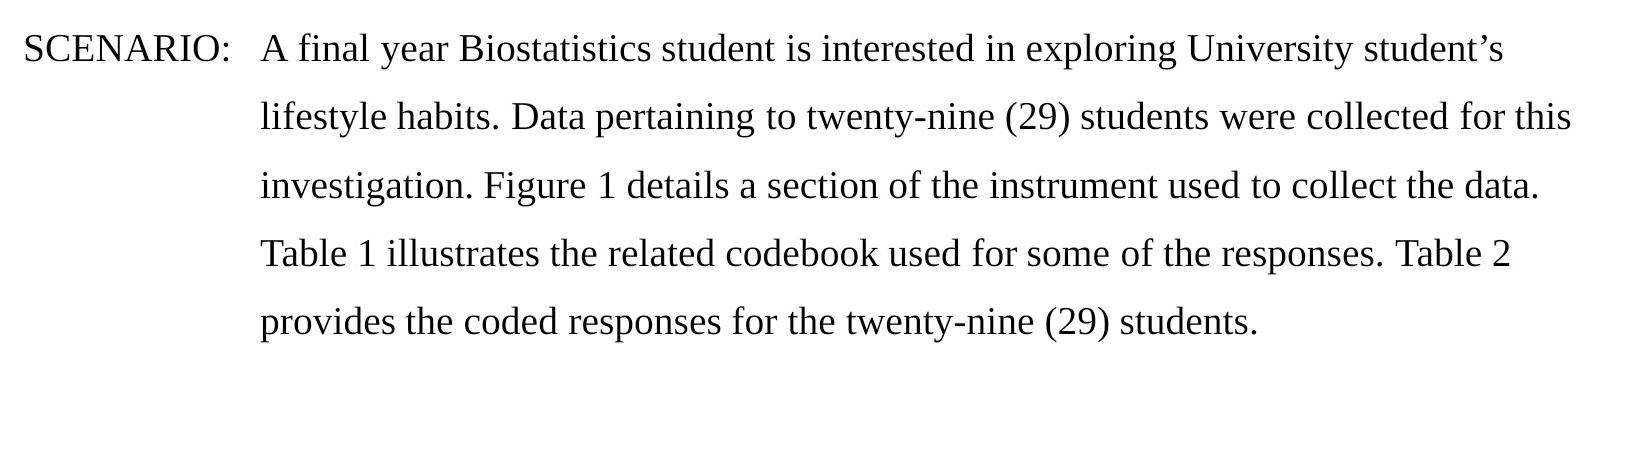
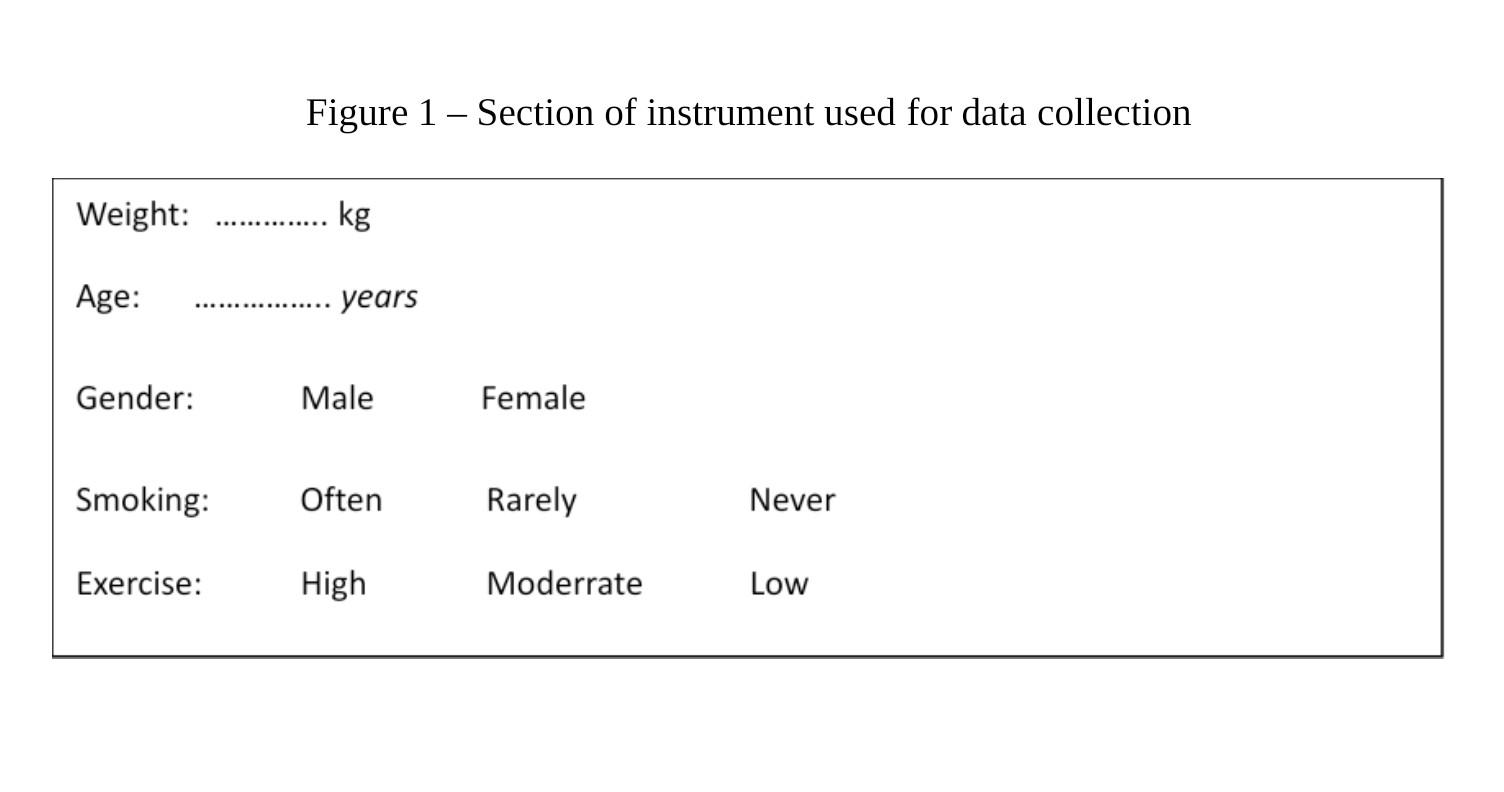
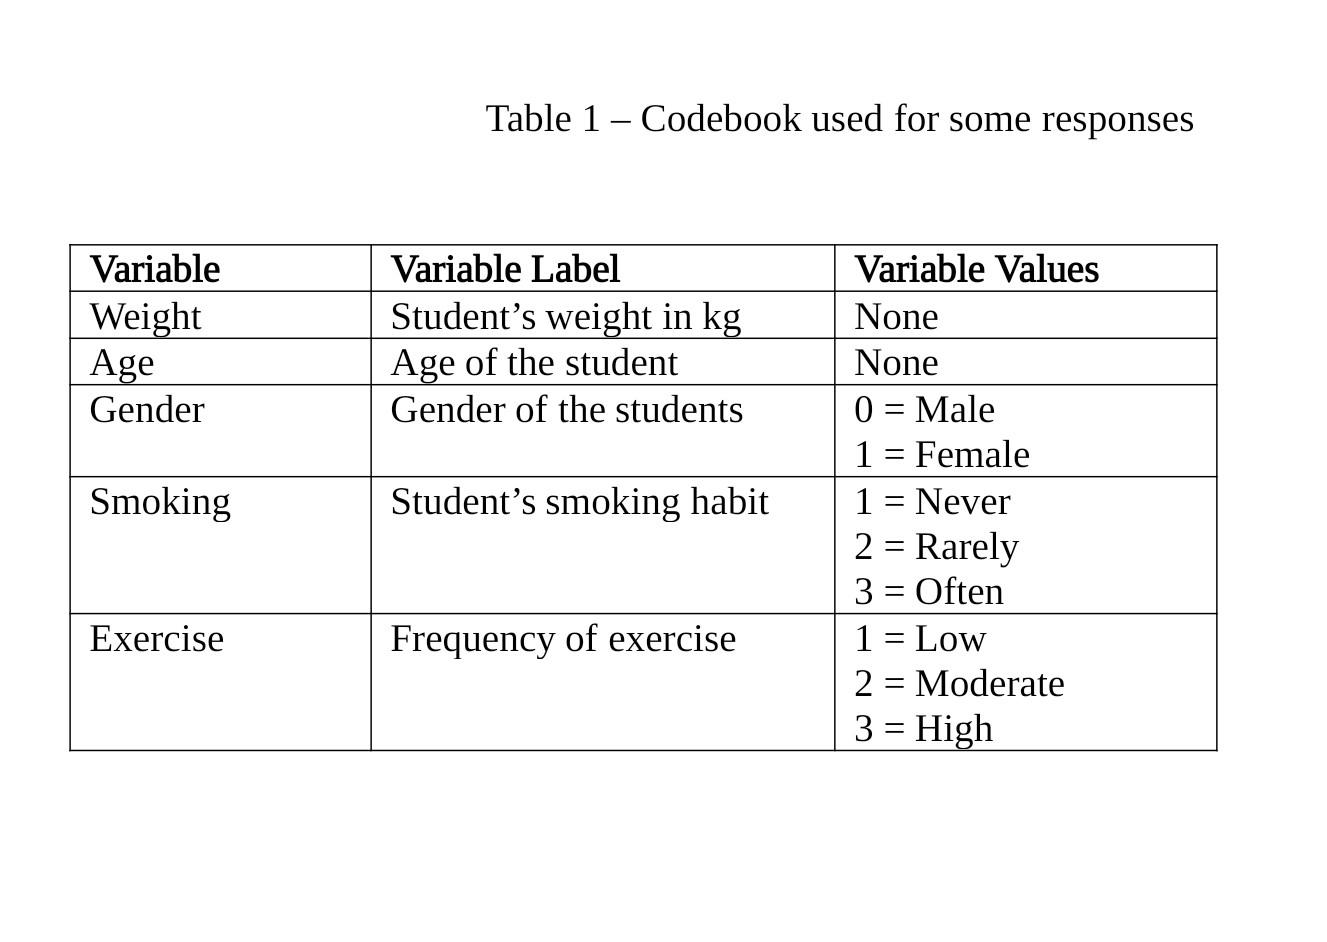
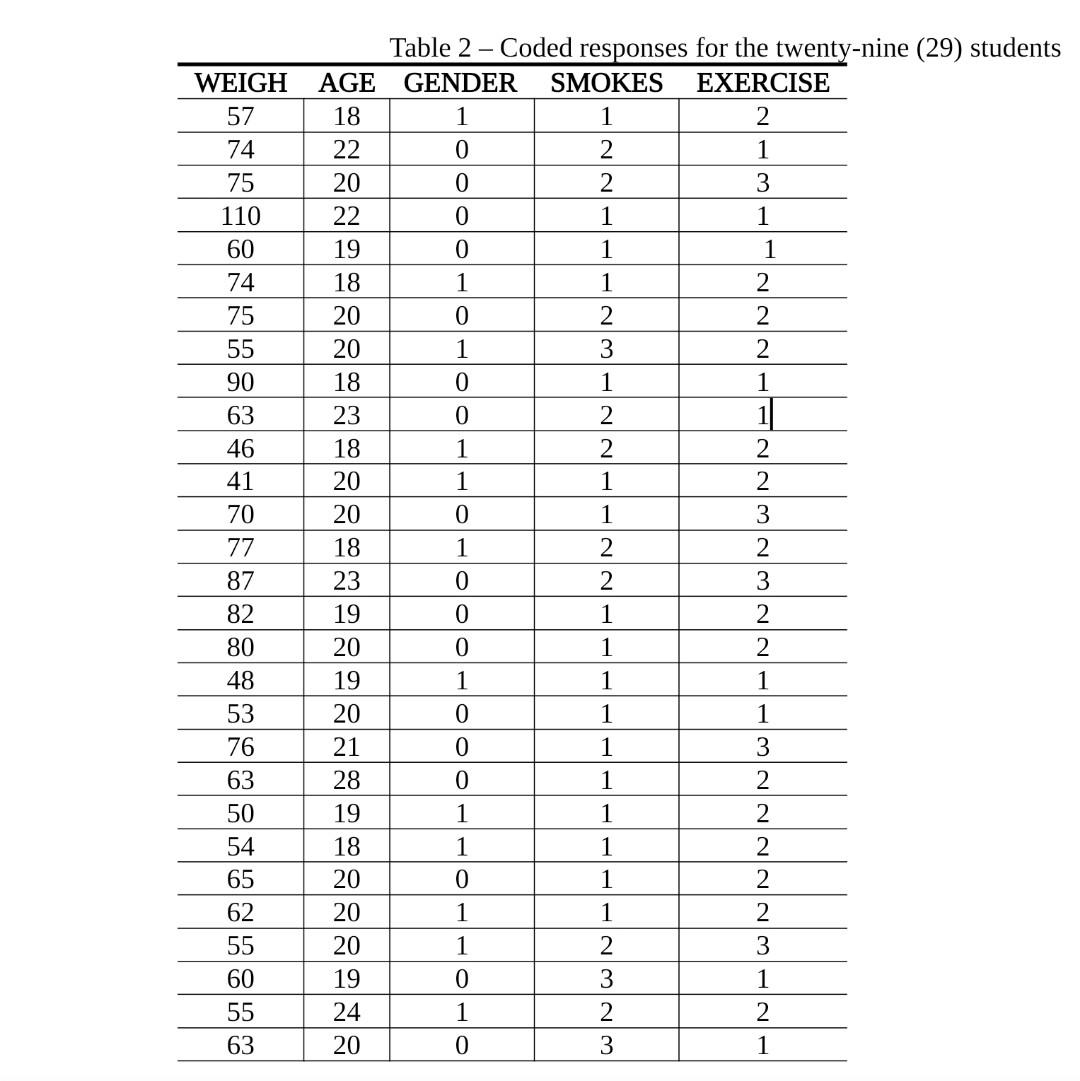
SCENARIO: A final year Biostatistics student is interested in exploring University student's lifestyle habits. Data pertaining to twenty-nine (29) students were collected for this investigation. Figure 1 details a section of the instrument used to collect the data. Table 1 illustrates the related codebook used for some of the responses. Table 2 provides the coded responses for the twenty-nine (29) students. Figure 1 - Section of instrument used for data collection Weight: kg Age: years Gender: Male Female Smoking: Often Rarely Never Exercise: High Moderrate Low Table 1 - Codebook used for some responses Variable Weight Age Gender Variable Label Student's weight in kg Age of the student Gender of the students Smoking Student's smoking habit Variable Values None None 0 = Male 1 = Female 1 = Never 2 = Rarely 3 = Often 1 = Low 2 = Moderate 3 = High Exercise Frequency of exercise WEIGH 57 74 75 110 60 74 75 55 90 63 46 41 70 77 87 82 80 48 53 76 63 50 54 65 62 55 60 55 63 Table 2 - Coded responses for the twenty-nine (29) students AGE GENDER SMOKES EXERCISE 18 1 1 2 22 0 2 1 20 2 3 22 0 1 1 19 0 1 1 18 1 1 2 20 0 2 2 20 3 2 18 0 1 1 23 0 2 11 18 1 2 2 20 1 1 2 20 0 1 3 18 1 2 2 23 0 2 3 19 0 1 2 20 0 1 2 19 1 1 1 20 0 1 1 21 0 1 3 28 1 2 19 1 2 18 1 1 2 20 0 1 2 20 1 1 2 20 1 2 3 19 0 3 1 24 2 2 20 0 3 1 Task 5: Use the Transform option to create a new variable called Weight_Classes from the variable Weight. This new variable should be formed in order to satisfy the criteria in table 3. Produce a frequency distribution for this new variable ensuring that the appropriate labels are included. Table 3 - Particulars for new variable Weight_Classes Weight 80 3 = Students weight above 80kg Task 6: For the data variables Weight_Classes and Exercise, use the Crosstabs option to: a) produce a cross-tabulation summarizing the data; b) determine whether the weight classes are associated with level of exercise by using an appropriate test at a 1% level of significance. Ensure that the hypotheses for the test are stated. SCENARIO: A final year Biostatistics student is interested in exploring University student's lifestyle habits. Data pertaining to twenty-nine (29) students were collected for this investigation. Figure 1 details a section of the instrument used to collect the data. Table 1 illustrates the related codebook used for some of the responses. Table 2 provides the coded responses for the twenty-nine (29) students. Figure 1 - Section of instrument used for data collection Weight: kg Age: years Gender: Male Female Smoking: Often Rarely Never Exercise: High Moderrate Low Table 1 - Codebook used for some responses Variable Weight Age Gender Variable Label Student's weight in kg Age of the student Gender of the students Smoking Student's smoking habit Variable Values None None 0 = Male 1 = Female 1 = Never 2 = Rarely 3 = Often 1 = Low 2 = Moderate 3 = High Exercise Frequency of exercise WEIGH 57 74 75 110 60 74 75 55 90 63 46 41 70 77 87 82 80 48 53 76 63 50 54 65 62 55 60 55 63 Table 2 - Coded responses for the twenty-nine (29) students AGE GENDER SMOKES EXERCISE 18 1 1 2 22 0 2 1 20 2 3 22 0 1 1 19 0 1 1 18 1 1 2 20 0 2 2 20 3 2 18 0 1 1 23 0 2 11 18 1 2 2 20 1 1 2 20 0 1 3 18 1 2 2 23 0 2 3 19 0 1 2 20 0 1 2 19 1 1 1 20 0 1 1 21 0 1 3 28 1 2 19 1 2 18 1 1 2 20 0 1 2 20 1 1 2 20 1 2 3 19 0 3 1 24 2 2 20 0 3 1 Task 5: Use the Transform option to create a new variable called Weight_Classes from the variable Weight. This new variable should be formed in order to satisfy the criteria in table 3. Produce a frequency distribution for this new variable ensuring that the appropriate labels are included. Table 3 - Particulars for new variable Weight_Classes Weight 80 3 = Students weight above 80kg Task 6: For the data variables Weight_Classes and Exercise, use the Crosstabs option to: a) produce a cross-tabulation summarizing the data; b) determine whether the weight classes are associated with level of exercise by using an appropriate test at a 1% level of significance. Ensure that the hypotheses for the test are stated
Step by Step Solution
There are 3 Steps involved in it

Get step-by-step solutions from verified subject matter experts