

Question: The Test Scores for a Statistics course are given in the Excel below. The data (X1, X2, X3, X4) are for each student. X1 =
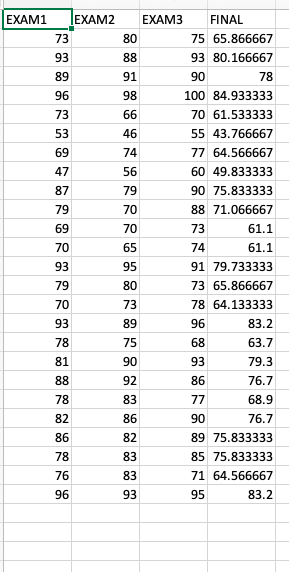
The Test Scores for a Statistics course are given in the Excel below. The data (X1, X2, X3, X4) are for each student. X1 = score on exam #1 X2 = score on exam #2 X3 = score on exam #3 X4 = score on final exam Your professor wants to know if all tests are created equal. What is the F-Stat?EXAM1 EXAM2 EXAM3 FINAL 73 80 75 65.866667 93 88 93 80.166667 89 91 90 78 96 98 100 84.933333 73 66 70 61.533333 53 46 55 43.766667 69 74 77 64.566667 47 56 60 49.833333 87 79 90 75.833333 79 70 88 71.066667 69 70 73 61.1 70 65 74 61.1 93 95 91 79.733333 79 80 73 65.866667 70 73 78 64.133333 93 89 96 83.2 78 75 68 63.7 81 90 93 79.3 88 92 86 76.7 78 83 77 68.9 82 86 90 76.7 86 82 89 75.833333 78 83 85 75.833333 76 83 71 64.566667 96 93 95 83.2
Step by Step Solution
There are 3 Steps involved in it

Get step-by-step solutions from verified subject matter experts