

Question: The three lines in the graph plot the NPV profiles of projects A, B and C in the data table, above. Line 2 is the
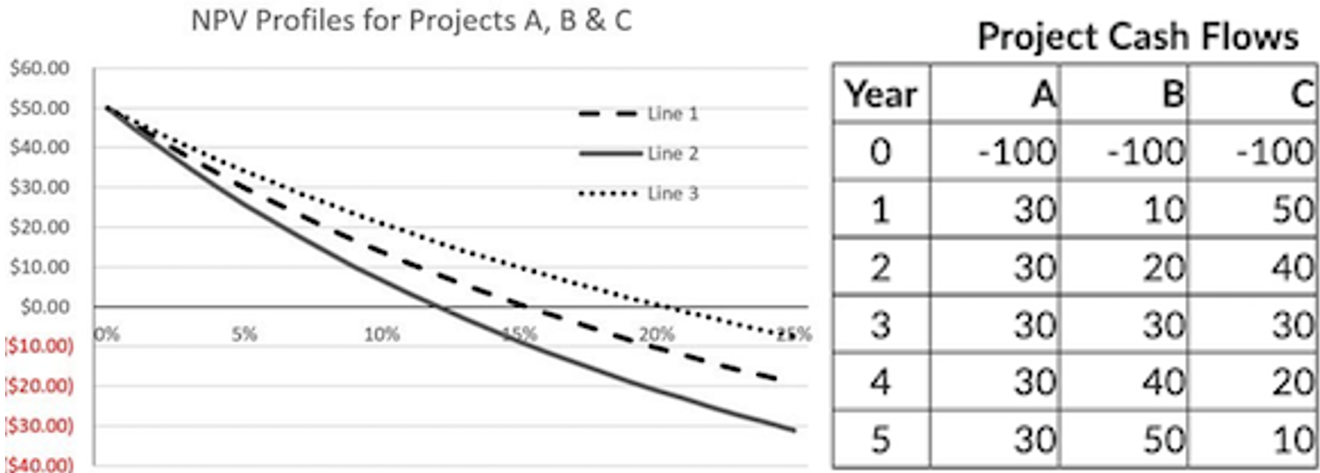
The three lines in the graph plot the NPV profiles of projects A, B and C in the data table, above. Line 2 is the NPV profile for Project
A? B? C?
PLEASE EXPLAIN WITH FULL SOLUTIONS AND EXPLANTIONS!!
NPV Profiles for Projects A, B \& C Proiect Cach Flnws
Step by Step Solution
There are 3 Steps involved in it
1 Expert Approved Answer
Step: 1 Unlock

Question Has Been Solved by an Expert!
Get step-by-step solutions from verified subject matter experts
Step: 2 Unlock
Step: 3 Unlock