

Question: The time for each activity to complete, the possible weeks by which that time can be reduced and the cost per week to decrease the
The time for each activity to complete, the possible weeks by which that time can be reduced and the cost per week to decrease the activity time. The cost to complete the project in normal time is $11,000 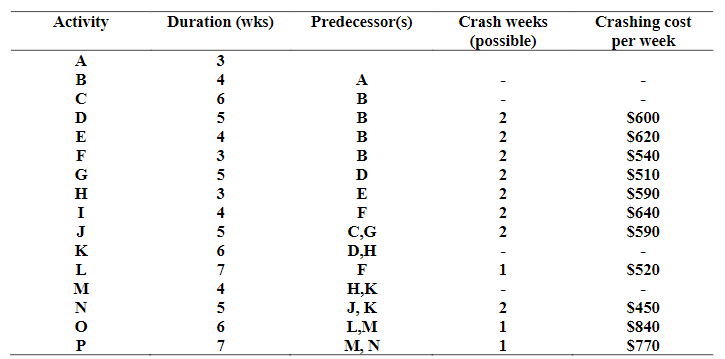
a. Draw the project network diagram for this project and identify those activities with slack number? (10%) b. What is the minimum time duration of the project? (5%) c. What is the critical path of the project? (5%) d. How much will be the most economical way to complete the project in 28 weeks? (10%) in 26 weeks?(10%)
Management decided to implement the project described in the following table: 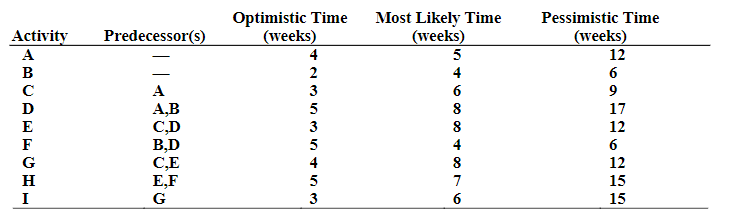
a. Draw the project network. (5%) b. What is the expected completion time of the project? (10%) (i.e., must list all the possible paths and find the longest one as the expected completion path) c. If one path has the longest expected completion time, why is it not necessarily the critical path? (5%) d. What are the variances for each activity?(10%) e. Assuming that the path completion times are independent, what is the probability of completing the project in 40 weeks? (10%) f. Given the same assumption as in part (e), what is the probability of completing the project in 35 weeks? (10%)
\begin{tabular}{ccccc} Activity & Predecessor(s) & OptimisticTime(weeks) & MostLikelyTime(weeks) & PessimisticTime(weeks) \\ \hline A & - & 4 & 5 & 12 \\ B & L & 2 & 4 & 6 \\ C & A & 3 & 6 & 9 \\ D & A,B & 5 & 8 & 17 \\ E & C,D & 3 & 8 & 12 \\ F & B,D & 5 & 4 & 6 \\ G & C,E & 4 & 8 & 12 \\ H & E,F & 5 & 7 & 15 \\ I & G & 3 & 6 & 15 \\ \hline \end{tabular}
Step by Step Solution
There are 3 Steps involved in it

Get step-by-step solutions from verified subject matter experts