

The time, in minutes, it takes a random sample of 25 workers to complete a specific task
Fantastic news! We've Found the answer you've been seeking!
Question:
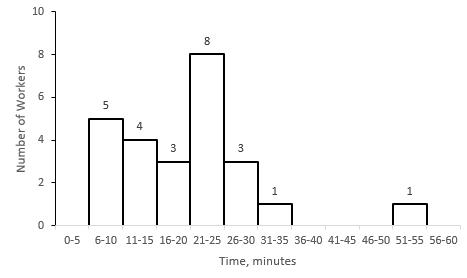 It was determined that the largest observation, 55 minutes, is an outlier, because Q3 + 1.5(Q3 − Q1) = 42.25. A boxplot has been created.
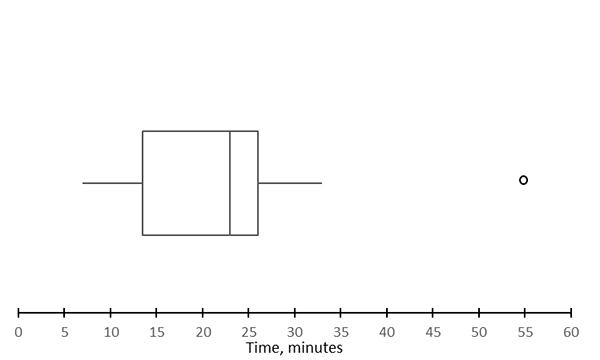
Does the boxplot represent the information given in the histogram? (3 points)
a. Yes
b. No, the boxplot should be skewed right
c. No, the median should be in the middle of the box
d. No, the left whisker should extend to zero
e. No, the right whisker should extend to 55
Expert Answer:
Does the boxplot represent the information given in the histogram 3 points Answer a Yes b No the b... View the full answer

Related Book For 

Elementary Statistics
ISBN: 978-0538733502
11th edition
Authors: Robert R. Johnson, Patricia J. Kuby
Posted Date:
