

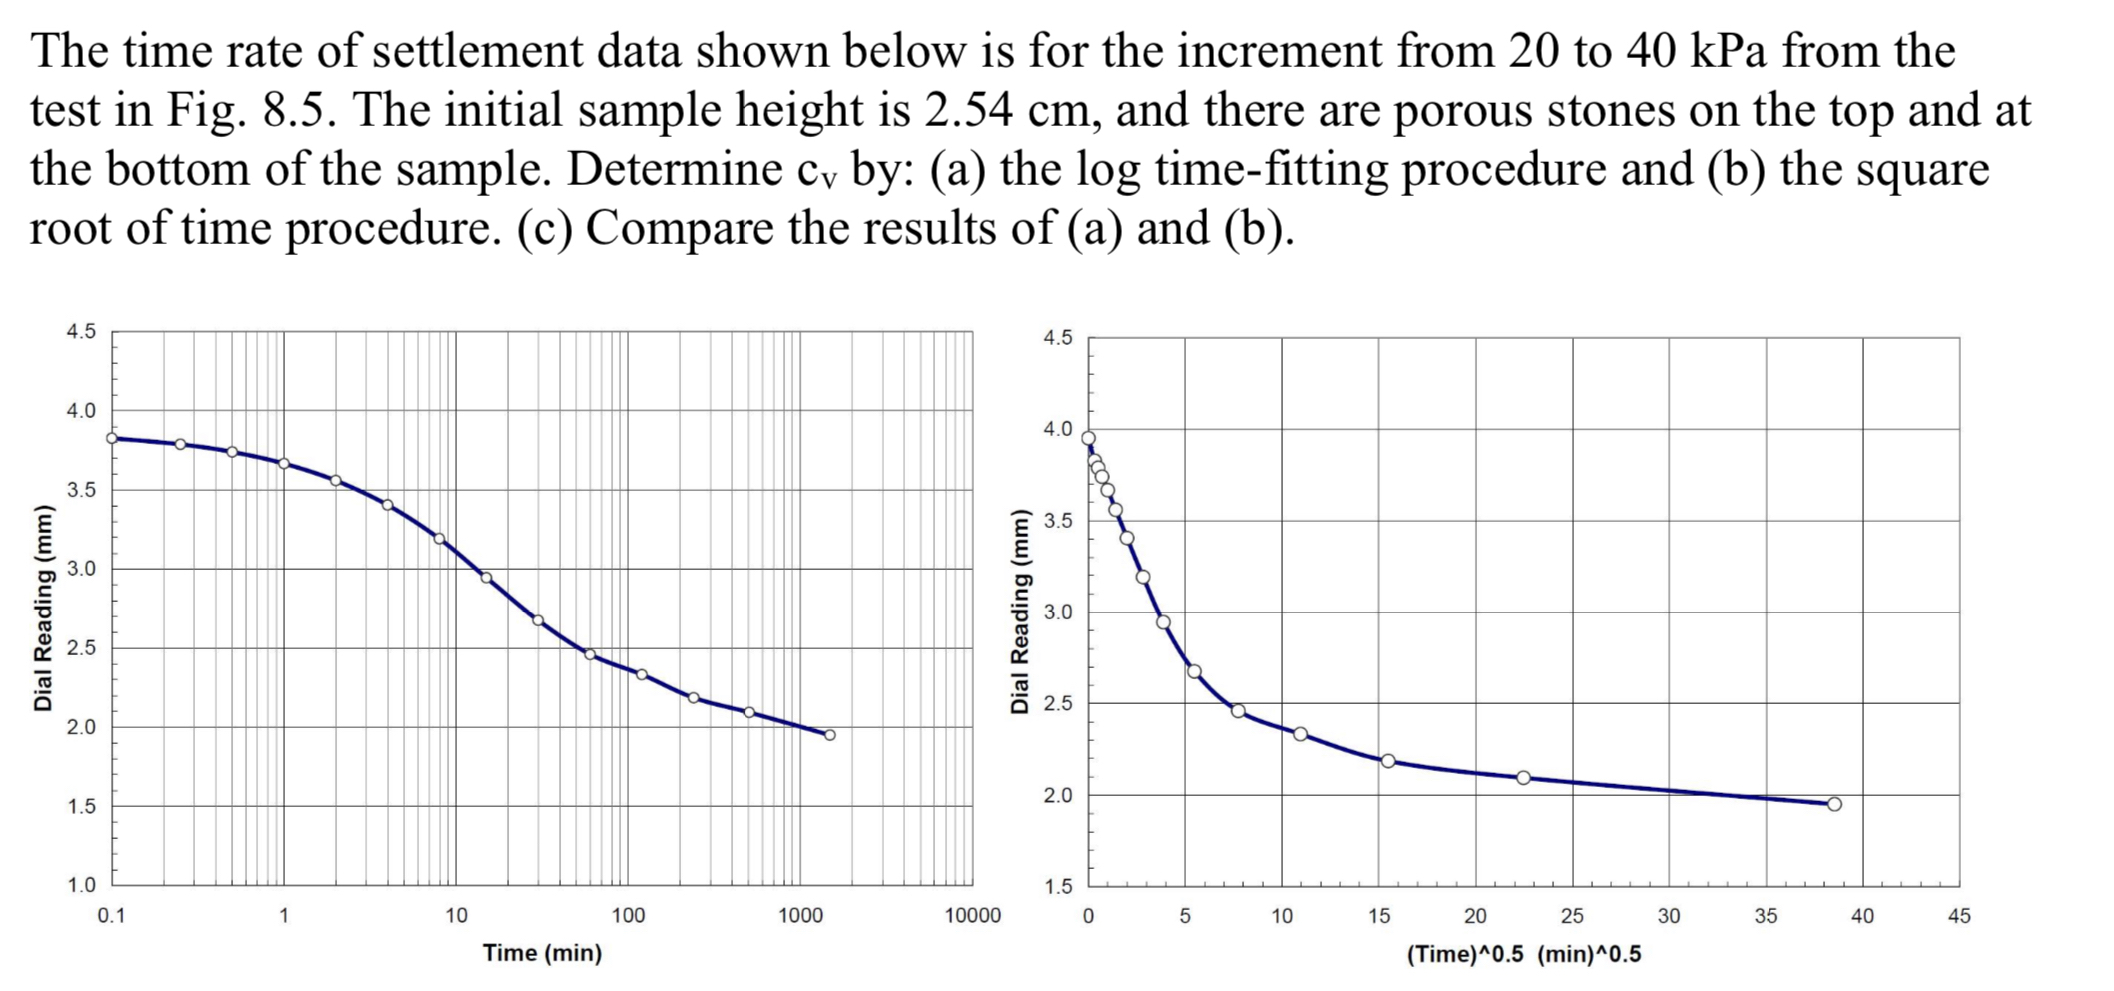
Question: The time rate of settlement data shown below is for the increment from 2 0 to 4 0 kPa from the test in Fig. 8
The time rate of settlement data shown below is for the increment from to kPa from the test in Fig. The initial sample height is and there are porous stones on the top and at the bottom of the sample. Determine by: a the log timefitting procedure and b the square root of time procedure. c Compare the results of a and b
Step by Step Solution
There are 3 Steps involved in it
1 Expert Approved Answer
Step: 1 Unlock

Question Has Been Solved by an Expert!
Get step-by-step solutions from verified subject matter experts
Step: 2 Unlock
Step: 3 Unlock