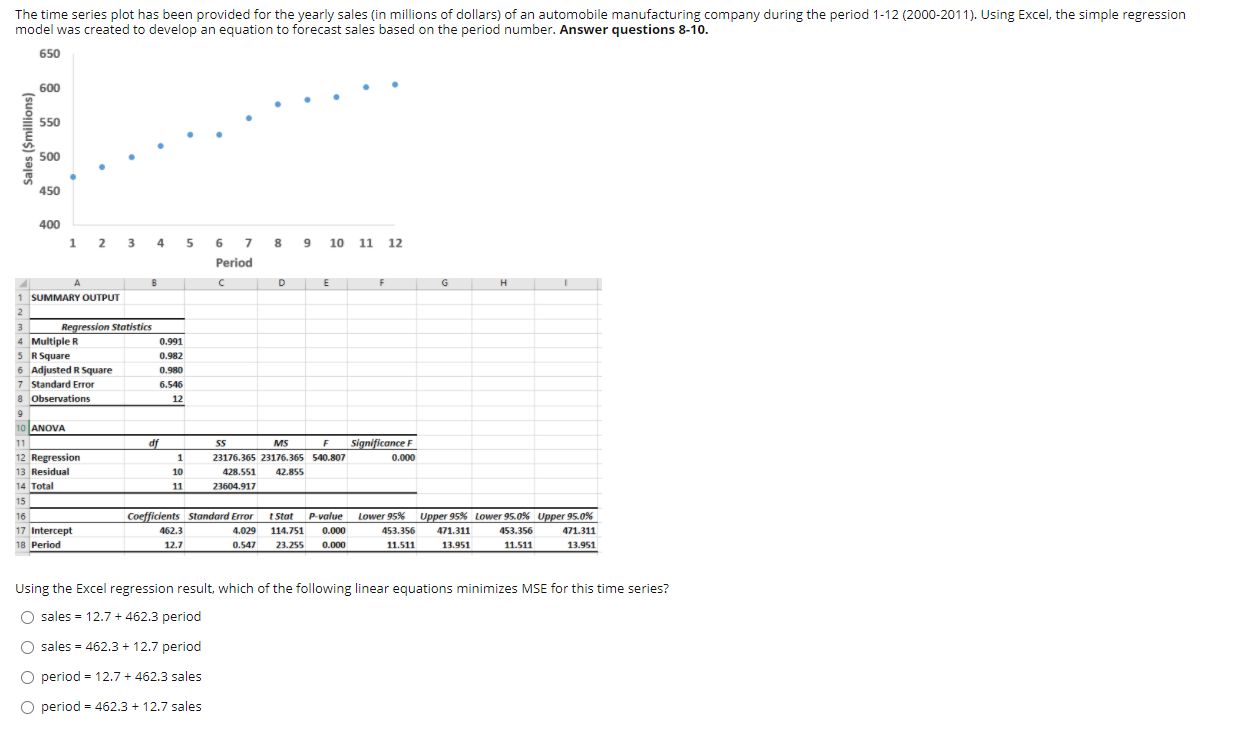
Question: The time series plot has been provided for the yearly sales (in millions of dollars) of an automobile manufacturing company during the period 1-12 (2000-2011).

The time series plot has been provided for theThe time series plot has been provided for the

The time series plot has been provided for the yearly sales (in millions of dollars) of an automobile manufacturing company during the period 1-12 (2000-2011). Using Excel, the simple regression model was created to develop an equation to forecast sales based on the period number. Answer questions 8-10. 650 600 550 Sales (Smillions) 500 450 400 8 9 1 2 3 4 5 6 7 Period 10 11 12 B C D E F G H 1 SUMMARY OUTPUT Regression Statistics 4 Multiple R 0.991 5 R Square 0.982 6 Adjusted R Square 0.980 7 Standard Error 6.546 8 Observations 12 9 10 ANOVA 11 df SS MS F Significance F 12 Regression 1 1 23176.365 23176.365 540.807 0.000 13 Residual 10 428.551 42.855 14 Total 11 23604.917 15 16 Coefficients Standard Error Stol P-value Lower 95% Upper 95% Lower 95.0% Upper 95.0% 17 Intercept 462.3 4,029 114.751 0.000 453.356 471.311 453.356 471.311 18 Period 12.7 0.547 23.255 0.000 11.511 13.951 11.511 13.951 Using the Excel regression result, which of the following linear equations minimizes MSE for this time series? O sales = 12.7 + 462.3 period O sales = 462.3 + 12.7 period O period - 12.7 +462.3 sales O period = 462.3 + 12.7 sales QUESTION 9 What is the sales forecast (in millions of dollars) for the year 2012 (period 13)? 6022.6 5560.3 614.7 627.4 QUESTION 10 What is the yearly change in forecast sales in millions of dollars)? O 12.7 increase 462.3 increase O 12.7 decrease 462.3 decrease

Step by Step Solution

There are 3 Steps involved in it

1 Expert Approved Answer
Step: 1 Unlock blur-text-image
Question Has Been Solved by an Expert!

Get step-by-step solutions from verified subject matter experts

Step: 2 Unlock
Step: 3 Unlock

Students Have Also Explored These Related General Management Questions!