

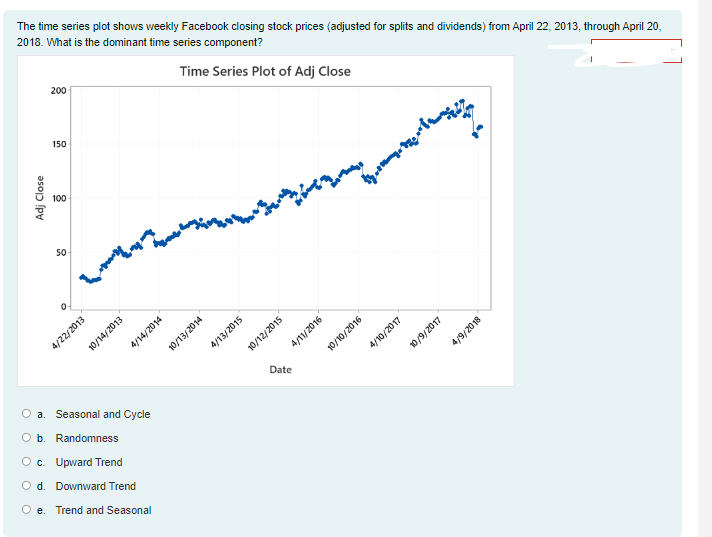
Question: The time series plot shows weekly Facebook closing stock prices ( adjusted for splits and dividends ) from April 2 2 , 2 0 1
The time series plot shows weekly Facebook closing stock prices adjusted for splits and dividends from April through April
What is the dominant time series component?
a Seasonal and Cycle
b Randomness
c Upward Trend
d Downward Trend
e Trend and Seasonal
Step by Step Solution
There are 3 Steps involved in it
1 Expert Approved Answer
Step: 1 Unlock

Question Has Been Solved by an Expert!
Get step-by-step solutions from verified subject matter experts
Step: 2 Unlock
Step: 3 Unlock